Phase 1 - Core Setup and Wazuh Deployment
Last updated by: Syed Mahmood Aleem Huzaifa, Last updated on: 29/06/2025
Document Creation: 17 May 2025. Last Edited: 23 May 2025. Authors: Syed Mahmood Aleem Huzaifa.
Effective Date: 23 May 2025. Expiry Date: 23 May 2026.
Overview
Phase 1 covers the foundational setup of the Wazuh security monitoring system by deploying a manager on an Ubuntu virtual machine and an agent on a Debian virtual machine. It includes preparing the network, updating system packages, setting hostnames, and installing the Wazuh Manager and Agent using official repositories. The phase ensures secure communication between the manager and agent through key-based registration and custom configuration using ossec.conf. It also addresses logging limitations by installing rsyslog on Debian to enable proper authentication event logging. The phase concludes with the installation of the Wazuh Indexer and Dashboard to complete the all-in-one platform. This provides a web interface for managing alerts and agent activity, ensuring a fully functional and integrated Wazuh environment ready for threat detection and analysis.
Step 1: Prepare your Virtual Machines
Manager VM: Ubuntu 22.04 or 20.04
Agent VM: Debian 11 or 12
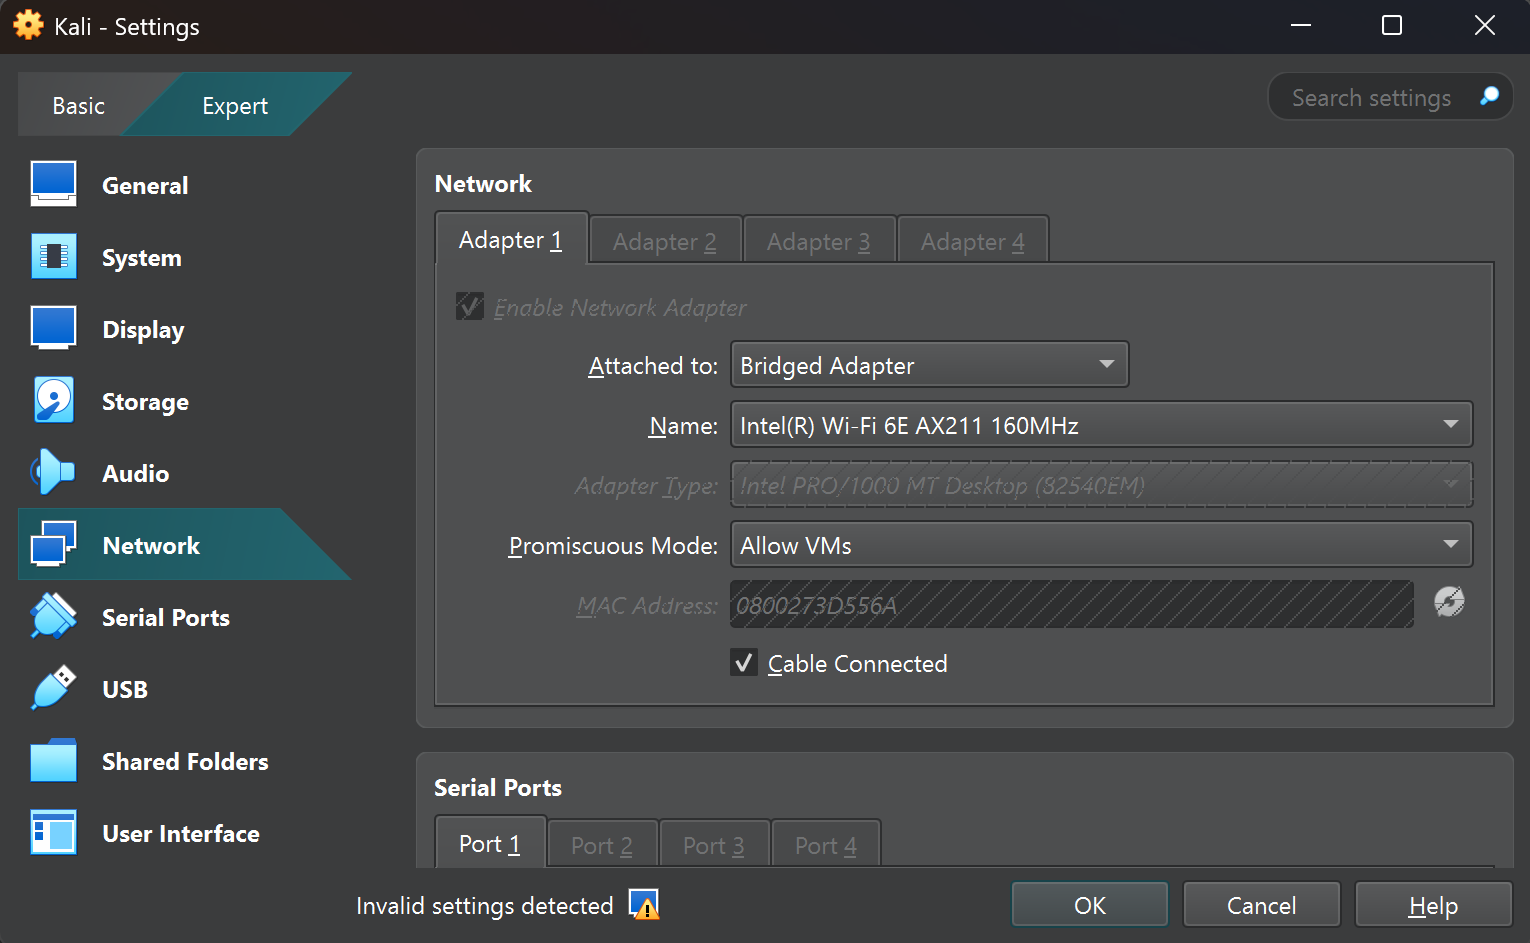
VMs Network Configuration:
- Set both the VMs on the same network. Preferably use a Bridged Adapter or an Internal Network. (IMPORTANT)
- Make sure both machines can ping each other to verify network connectivity.
Step 2: Update and Set Hostnames
On both machines, first run the following command:
sudo apt update && sudo apt upgrade -y
On the manager VM:
sudo hostnamectl set-hostname wazuh-manager
On the Agent VM:
sudo hostnamectl set-hostname wazuh-agent
Now reboot both the VMs using the command
sudo reboot
Setting the hostname on your Wazuh Manager and Agent VMs is not strictly mandatory, but it is highly recommended for clarity and proper configuration in your Wazuh environment. It helps with identification, making it easier to differentiate between multiple VMs, and ensures better organisation when reviewing logs and alerts, as some may include the hostname, simplifying troubleshooting. Additionally, configuration consistency is improved since some services rely on a stable hostname.
Step 2: Install Wazuh Manager on Ubuntu (Manager VM)
- Import the Wazuh GPG Key
curl -s https://packages.wazuh.com/key/GPG-KEY-WAZUH | sudo gpg --dearmor -o /usr/share/keyrings/wazuh-archive-keyring.gpg
If curl is not installed then it can be installed using
sudo apt install curl
- Add the Wazuh repository:
echo "deb [signed-by=/usr/share/keyrings/wazuh-archive-keyring.gpg] https://packages.wazuh.com/4.x/apt/ stable main" | sudo tee /etc/apt/sources.list.d/wazuh.list
- Install Wazuh Manager:
a.
sudo apt updateb.sudo apt install wazuh-manager -y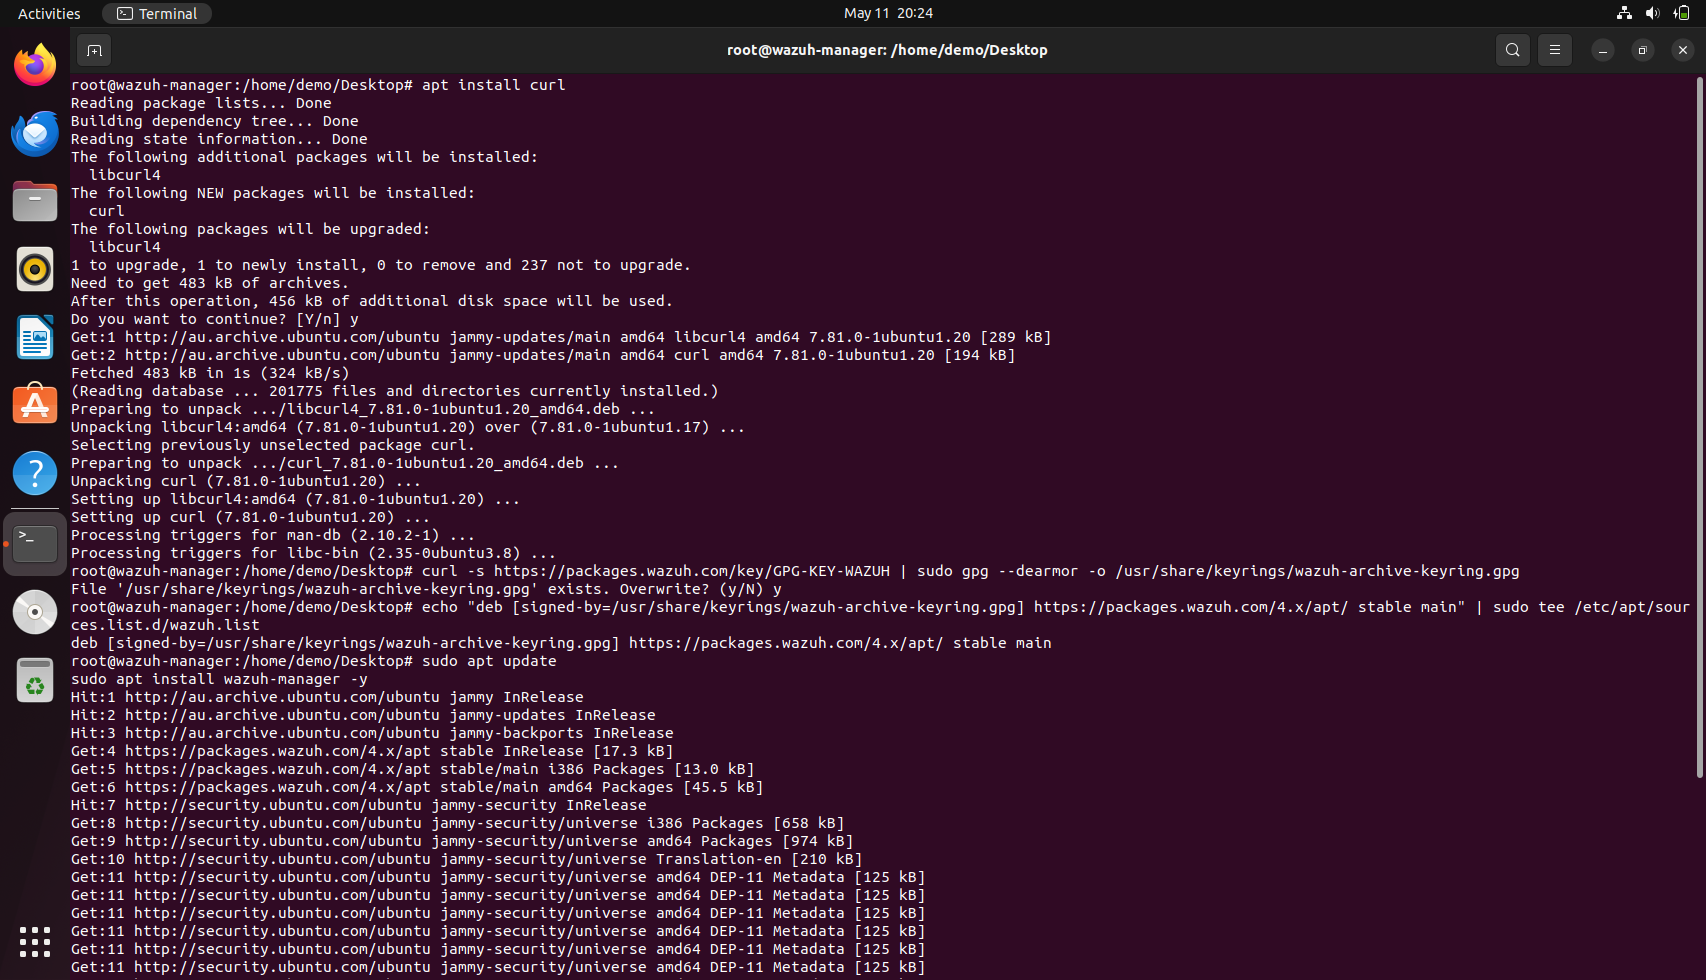
- Start and enable Wazuh Manager:
a.
sudo systemctl daemon-reloadb.sudo systemctl enable wazuh-managerc.sudo systemctl start wazuh-managerThe status of the wazuh manager can be checked using the command:sudo systemctl status wazuh-manager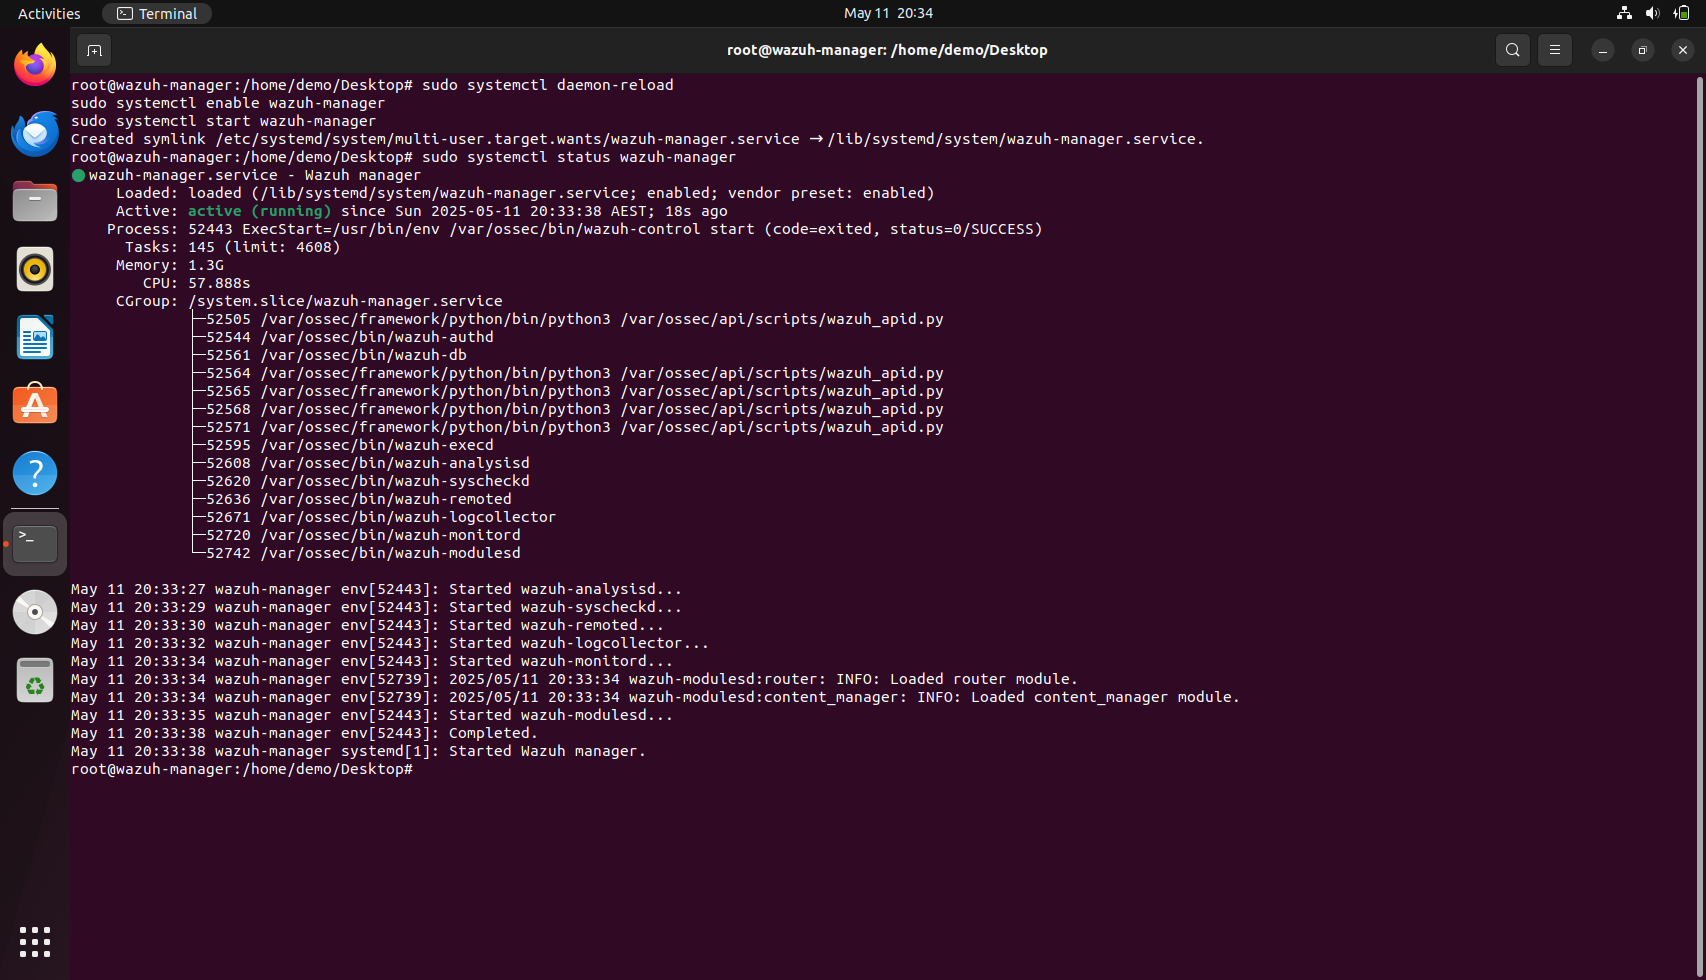
If active (running), the Manager is ready.
Step 3: Install Wazuh Agent on Debian (Agent VM)
You can use any Linux distribution or even a Windows machine to act as an agent. In this setup, a Debian system has been chosen.
If you're installing Debian, it's important to ensure that GRUB, the bootloader, is properly installed and configured. GRUB plays a crucial role in managing the boot process, allowing for a smooth startup, troubleshooting, and easy selection between multiple operating systems. Without it, your system may fail to boot or have difficulty recognising installed OSes.
Additionally, Debian includes a desktop environment by default during installation, with GNOME often being the standard choice. However, users can opt for alternatives like Xfce, KDE, or LXQt if they prefer a different look and feel. Choosing the right desktop environment enhances usability by providing an intuitive graphical interface, making system navigation much more seamless compared to using only the command line.
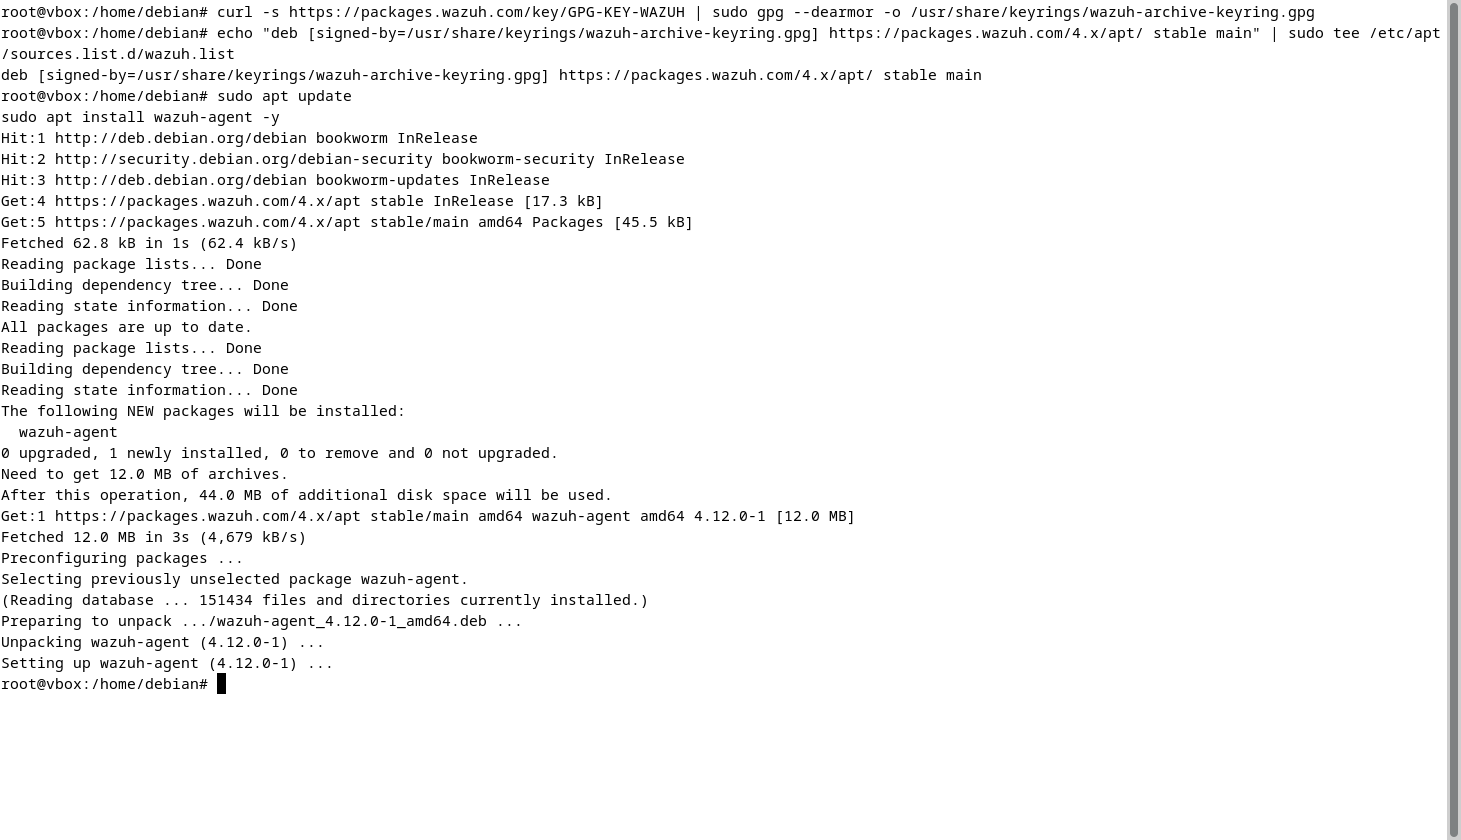
- Import Wazuh GPG key:
curl -s https://packages.wazuh.com/key/GPG-KEY-WAZUH | sudo gpg --dearmor -o /usr/share/keyrings/wazuh-archive-keyring.gpg
- Add Wazuh repository:
echo "deb [signed-by=/usr/share/keyrings/wazuh-archive-keyring.gpg] https://packages.wazuh.com/4.x/apt/ stable main" | sudo tee /etc/apt/sources.list.d/wazuh.list
- Install Wazuh Agent:
sudo apt update
sudo apt install wazuh-agent -y
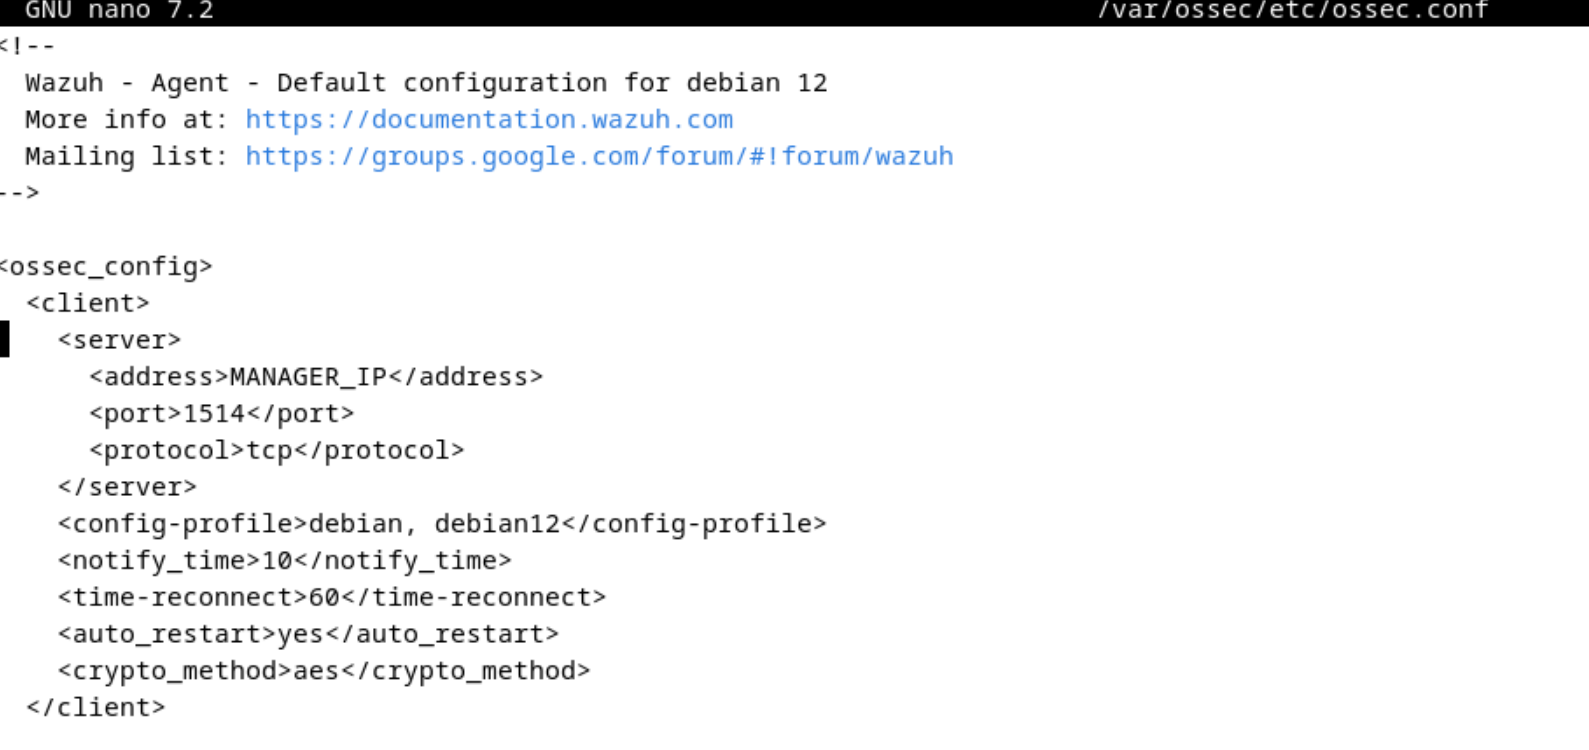
 4. Configure the agent to connect to the Manager: Open the agent configuration file using the command sudo nano /var/ossec/etc/ossec.conf, and where MANAGER_IP is mentioned, enter the IP address of the Ubuntu VM or where your Wazuh Manager is installed.
 Replace the content of the files with the content of the linked file
which should be similar to
Replace the content of the files with the content of the linked file
which should be similar to
<ossec_config>
  <global>
    <jsonout_output>yes</jsonout_output>
    <alerts_log>yes</alerts_log>
    <logall>no</logall>
    <logall_json>no</logall_json>
    <email_notification>no</email_notification>
    <smtp_server>smtp.example.wazuh.com</smtp_server>
    <email_from>wazuh@example.wazuh.com</email_from>
    <email_to>recipient@example.wazuh.com</email_to>
    <email_maxperhour>12</email_maxperhour>
    <email_log_source>alerts.log</email_log_source>
    <agents_disconnection_time>10m</agents_disconnection_time>
    <agents_disconnection_alert_time>0</agents_disconnection_alert_time>
  </global>

  <alerts>
    <log_alert_level>3</log_alert_level>
    <email_alert_level>12</email_alert_level>
  </alerts>

  <logging>
    <log_format>plain</log_format>
  </logging>

  <remote>
    <connection>secure</connection>
    <port>1514</port>
    <protocol>tcp</protocol>
    <queue_size>131072</queue_size>
  </remote>

  <rootcheck>
    <disabled>no</disabled>
    <check_files>yes</check_files>
    <check_trojans>yes</check_trojans>
    <check_dev>yes</check_dev>
    <check_sys>yes</check_sys>
    <check_pids>yes</check_pids>
    <check_ports>yes</check_ports>
    <check_if>yes</check_if>
    <frequency>43200</frequency>
    <rootkit_files>etc/rootcheck/rootkit_files.txt</rootkit_files>
    <rootkit_trojans>etc/rootcheck/rootkit_trojans.txt</rootkit_trojans>
    <skip_nfs>yes</skip_nfs>
  </rootcheck>

  <wodle name="cis-cat">
    <disabled>yes</disabled>
    <timeout>1800</timeout>
    <interval>1d</interval>
    <scan-on-start>yes</scan-on-start>
    <java_path>wodles/java</java_path>
    <ciscat_path>wodles/ciscat</ciscat_path>
  </wodle>

  <wodle name="osquery">
    <disabled>yes</disabled>
    <run_daemon>yes</run_daemon>
    <log_path>/var/log/osquery/osqueryd.results.log</log_path>
    <config_path>/etc/osquery/osquery.conf</config_path>
    <add_labels>yes</add_labels>
  </wodle>

  <wodle name="syscollector">
    <disabled>no</disabled>
    <interval>1h</interval>
    <scan_on_start>yes</scan_on_start>
    <hardware>yes</hardware>
    <os>yes</os>
    <network>yes</network>
    <packages>yes</packages>
    <ports all="no">yes</ports>
    <processes>yes</processes>
    <synchronization>
      <max_eps>10</max_eps>
    </synchronization>
  </wodle>

  <sca>
    <enabled>yes</enabled>
    <scan_on_start>yes</scan_on_start>
    <interval>12h</interval>
    <skip_nfs>yes</skip_nfs>
  </sca>

  <vulnerability-detector>
    <enabled>no</enabled>
    <interval>5m</interval>
    <min_full_scan_interval>6h</min_full_scan_interval>
    <run_on_start>yes</run_on_start>

    <provider name="canonical">
      <enabled>no</enabled>
      <os>trusty</os>
      <os>xenial</os>
      <os>bionic</os>
      <os>focal</os>
      <os>jammy</os>
      <update_interval>1h</update_interval>
    </provider>

    <provider name="debian">
      <enabled>no</enabled>
      <os>buster</os>
      <os>bullseye</os>
      <os>bookworm</os>
      <update_interval>1h</update_interval>
    </provider>

    <provider name="redhat">
      <enabled>no</enabled>
      <os>5</os>
      <os>6</os>
      <os>7</os>
      <os>8</os>
      <os>9</os>
      <update_interval>1h</update_interval>
    </provider>

    <provider name="alas">
      <enabled>no</enabled>
      <os>amazon-linux</os>
      <os>amazon-linux-2</os>
      <os>amazon-linux-2022</os>
      <os>amazon-linux-2023</os>
      <update_interval>1h</update_interval>
    </provider>

    <provider name="suse">
      <enabled>no</enabled>
      <os>11-server</os>
      <os>11-desktop</os>
      <os>12-server</os>
      <os>12-desktop</os>
      <os>15-server</os>
      <os>15-desktop</os>
      <update_interval>1h</update_interval>
    </provider>

    <provider name="arch">
      <enabled>no</enabled>
      <update_interval>1h</update_interval>
    </provider>

    <provider name="almalinux">
      <enabled>no</enabled>
      <os>8</os>
      <os>9</os>
      <update_interval>1h</update_interval>
    </provider>

    <provider name="msu">
      <enabled>yes</enabled>
      <update_interval>1h</update_interval>
    </provider>

    <provider name="nvd">
      <enabled>yes</enabled>
      <update_interval>1h</update_interval>
    </provider>
  </vulnerability-detector>

  <syscheck>
    <disabled>no</disabled>
    <frequency>43200</frequency>
    <scan_on_start>yes</scan_on_start>
    <alert_new_files>yes</alert_new_files>
    <auto_ignore frequency="10" timeframe="3600">no</auto_ignore>

    <directories check_all="yes" realtime="yes">/etc</directories>
    <directories check_all="yes">/usr/bin</directories>
    <directories check_all="yes">/usr/sbin</directories>
    <directories check_all="yes">/bin</directories>
    <directories check_all="yes">/sbin</directories>
    <directories check_all="yes">/boot</directories>

    <ignore>/etc/mtab</ignore>
    <ignore>/etc/hosts.deny</ignore>
    <ignore>/etc/mail/statistics</ignore>
    <ignore>/etc/random-seed</ignore>
    <ignore>/etc/random.seed</ignore>
    <ignore>/etc/adjtime</ignore>
    <ignore>/etc/httpd/logs</ignore>
    <ignore>/etc/utmpx</ignore>
    <ignore>/etc/wtmpx</ignore>
    <ignore>/etc/cups/certs</ignore>
    <ignore>/etc/dumpdates</ignore>
    <ignore>/etc/svc/volatile</ignore>

    <ignore type="sregex">.log$|.swp$</ignore>

    <nodiff>/etc/ssl/private.key</nodiff>

    <skip_nfs>yes</skip_nfs>
    <skip_dev>yes</skip_dev>
    <skip_proc>yes</skip_proc>
    <skip_sys>yes</skip_sys>

    <process_priority>10</process_priority>
    <max_eps>50</max_eps>

    <synchronization>
      <enabled>yes</enabled>
      <interval>5m</interval>
      <max_eps>10</max_eps>
    </synchronization>
  </syscheck>

  <global>
    <white_list>127.0.0.1</white_list>
    <white_list>^localhost.localdomain$</white_list>
    <white_list>127.0.0.53</white_list>
  </global>

  <command>
    <name>disable-account</name>
    <executable>disable-account</executable>
    <timeout_allowed>yes</timeout_allowed>
  </command>

  <command>
    <name>restart-wazuh</name>
    <executable>restart-wazuh</executable>
  </command>

  <command>
    <name>firewall-drop</name>
    <executable>firewall-drop</executable>
    <timeout_allowed>yes</timeout_allowed>
  </command>

  <command>
    <name>host-deny</name>
    <executable>host-deny</executable>
    <timeout_allowed>yes</timeout_allowed>
  </command>

  <command>
    <name>route-null</name>
    <executable>route-null</executable>
    <timeout_allowed>yes</timeout_allowed>
  </command>

  <command>
    <name>win_route-null</name>
    <executable>route-null.exe</executable>
    <timeout_allowed>yes</timeout_allowed>
  </command>

  <command>
    <name>netsh</name>
    <executable>netsh.exe</executable>
    <timeout_allowed>yes</timeout_allowed>
  </command>

  <integration>
    <name>custom-misp</name>
    <alert_format>json</alert_format>
    <level>7</level>
    <group>authentication_failed,sshd,custom_rules</group>
    <rule_id>100100</rule_id>
    <rule_id>110000</rule_id>
  </integration>

  <localfile>
    <log_format>command</log_format>
    <command>df -P</command>
    <frequency>360</frequency>
  </localfile>

  <localfile>
    <log_format>full_command</log_format>
    <command>netstat -tulpn | sed 's/\([[:alnum:]]\+\)\ \+[[:digit:]]\+\ \+[[:digit:]]\+\ \+\(.*\):\([[:digit:]]*\)\ \+\([0-9\.\:\*]\+\).\+\ \([[:digit:]]*\/[[:alnum:]\-]*\).*/\1 \2 == \3 == \4 \5/' | sort -k 4 -g | sed 's/ == \(.*\) ==/:\1/' | sed 1,2d</command>
    <alias>netstat listening ports</alias>
    <frequency>360</frequency>
  </localfile>

  <localfile>
    <log_format>full_command</log_format>
    <command>last -n 20</command>
    <frequency>360</frequency>
  </localfile>

  <localfile>
    <log_format>json</log_format>
    <location>/var/log/suricata/eve.json</location>
  </localfile>

  <localfile>
    <log_format>syslog</log_format>
    <location>/var/ossec/logs/active-responses.log</location>
  </localfile>

  <localfile>
    <log_format>syslog</log_format>
    <location>/var/log/auth.log</location>
  </localfile>

  <localfile>
    <log_format>syslog</log_format>
    <location>/var/log/syslog</location>
  </localfile>

  <localfile>
    <log_format>syslog</log_format>
    <location>/var/log/dpkg.log</location>
  </localfile>

  <localfile>
    <log_format>syslog</log_format>
    <location>/var/log/kern.log</location>
  </localfile>

  <ruleset>
    <decoder_dir>ruleset/decoders</decoder_dir>
    <rule_dir>ruleset/rules</rule_dir>
    <rule_exclude>0215-policy_rules.xml</rule_exclude>
    <list>etc/lists/audit-keys</list>
    <list>etc/lists/amazon/aws-eventnames</list>
    <list>etc/lists/security-eventchannel</list>
    <decoder_dir>etc/decoders</decoder_dir>
    <rule_dir>etc/rules</rule_dir>
  </ruleset>

  <rule_test>
    <enabled>yes</enabled>
    <threads>1</threads>
    <max_sessions>64</max_sessions>
    <session_timeout>15m</session_timeout>
  </rule_test>

  <auth>
    <disabled>no</disabled>
    <port>1515</port>
    <use_source_ip>no</use_source_ip>
    <purge>yes</purge>
    <use_password>no</use_password>
    <ciphers>HIGH:!ADH:!EXP:!MD5:!RC4:!3DES:!CAMELLIA:@STRENGTH</ciphers>
    <ssl_verify_host>no</ssl_verify_host>
    <ssl_manager_cert>etc/sslmanager.cert</ssl_manager_cert>
    <ssl_manager_key>etc/sslmanager.key</ssl_manager_key>
    <ssl_auto_negotiate>no</ssl_auto_negotiate>
  </auth>

  <cluster>
    <name>wazuh</name>
    <node_name>node01</node_name>
    <node_type>master</node_type>
    <key></key>
    <port>1516</port>
    <bind_addr>0.0.0.0</bind_addr>
    <nodes>
      <node>NODE_IP</node>
    </nodes>
    <hidden>no</hidden>
    <disabled>yes</disabled>
  </cluster>

  <active-response>
    <disabled>no</disabled>
    <command>firewall-drop</command>
    <location>local</location>
    <rules_id>5763</rules_id>
    <timeout>180</timeout>
  </active-response>
</ossec_config>
The changes in the attached file from the default file are outlined in the table below
Configuration Feature Comparison
| Feature | New Config | Default Config | Importance/Impact |
|---|---|---|---|
| Enrollment Block | Present (<enrollment>) | Missing | Important for auto-enrolling agents. Removal means agents must be registered manually. |
| Rootcheck - Ignore Docker Paths | Not present | Ignores /var/lib/containerd and /var/lib/docker/overlay2 | Reduces noise if containers are used; beneficial only if Docker or containerd is present. |
| Wodle - osquery | Enabled (<disabled>no</disabled>) | Disabled (<disabled>yes</disabled>) | Disabling reduces system visibility; osquery collects detailed system information useful for security. |
| Log Collection Method | Collects specific logs (Apache, Auth, Syslog, Suricata) | Collects only system logs via Journald | Original provides better and more granular monitoring. Journald-only approach risks missing specific service logs. |
| Apache, Suricata, Auth Logs | Explicitly monitored | Not monitored separately | Important for detecting web attacks, authentication events, and network intrusion alerts. Their removal weakens detection capabilities. |
| Localfile Count | More targeted logfiles | Fewer generalised logs | Targeted logfile monitoring is better for specific security detections. |
| Active Response | Enabled | Enabled | No difference. |
| SCA and Syscheck | Same | Same | No impact. |
- Start and enable the Wazuh Agent:
sudo systemctl daemon-reload
sudo systemctl enable wazuh-agent
sudo systemctl start wazuh-agent - Check Wazuh Agent status:
sudo systemctl status wazuh-agent

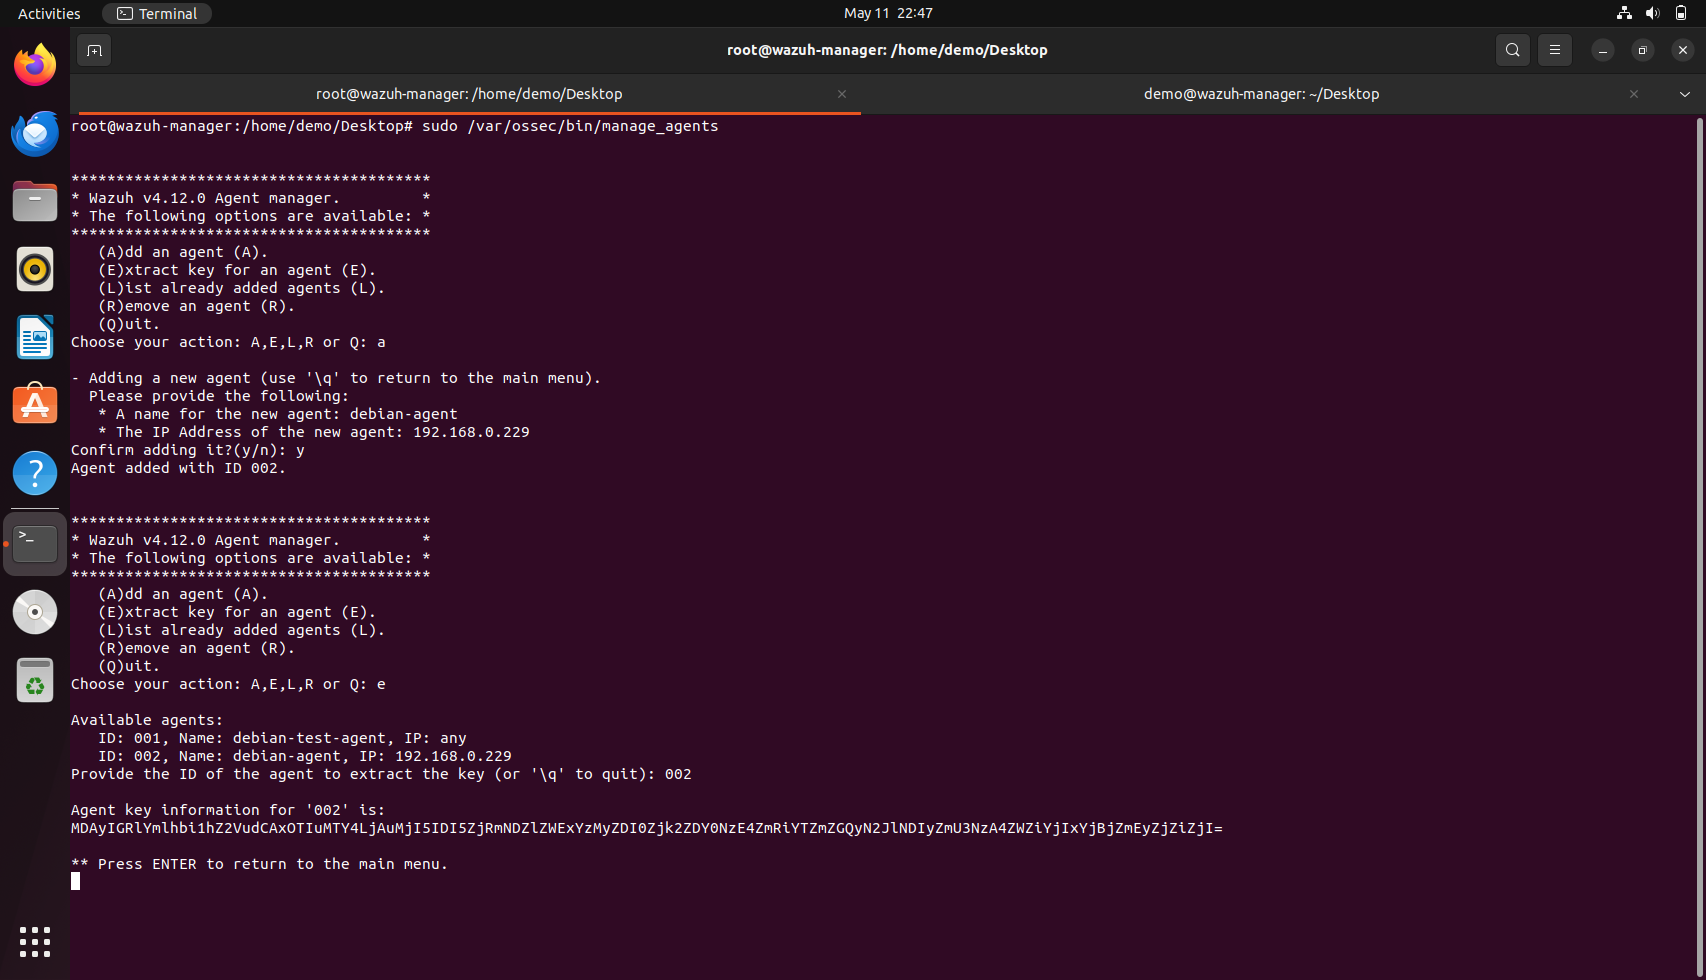
Step 4: Register Agent on the Manager
Part 1: On the Manager (Ubuntu VM), add the agent manually using the command: sudo /var/ossec/bin/manage_agents
Inside manage_agents:
• Press A to add an agent.
• Enter a name (example: debian-agent).
• Enter the agent IP address.
• The default group is fine unless you want a custom one.
You will get a Key after creation. Copy the Key.
Part 2: On the Agent (Debian VM), import the Key using the command
sudo /var/ossec/bin/agent-auth -m MANAGER_IP_ADDRESS -p 1515 -k <PASTE_YOUR_KEY_HERE>
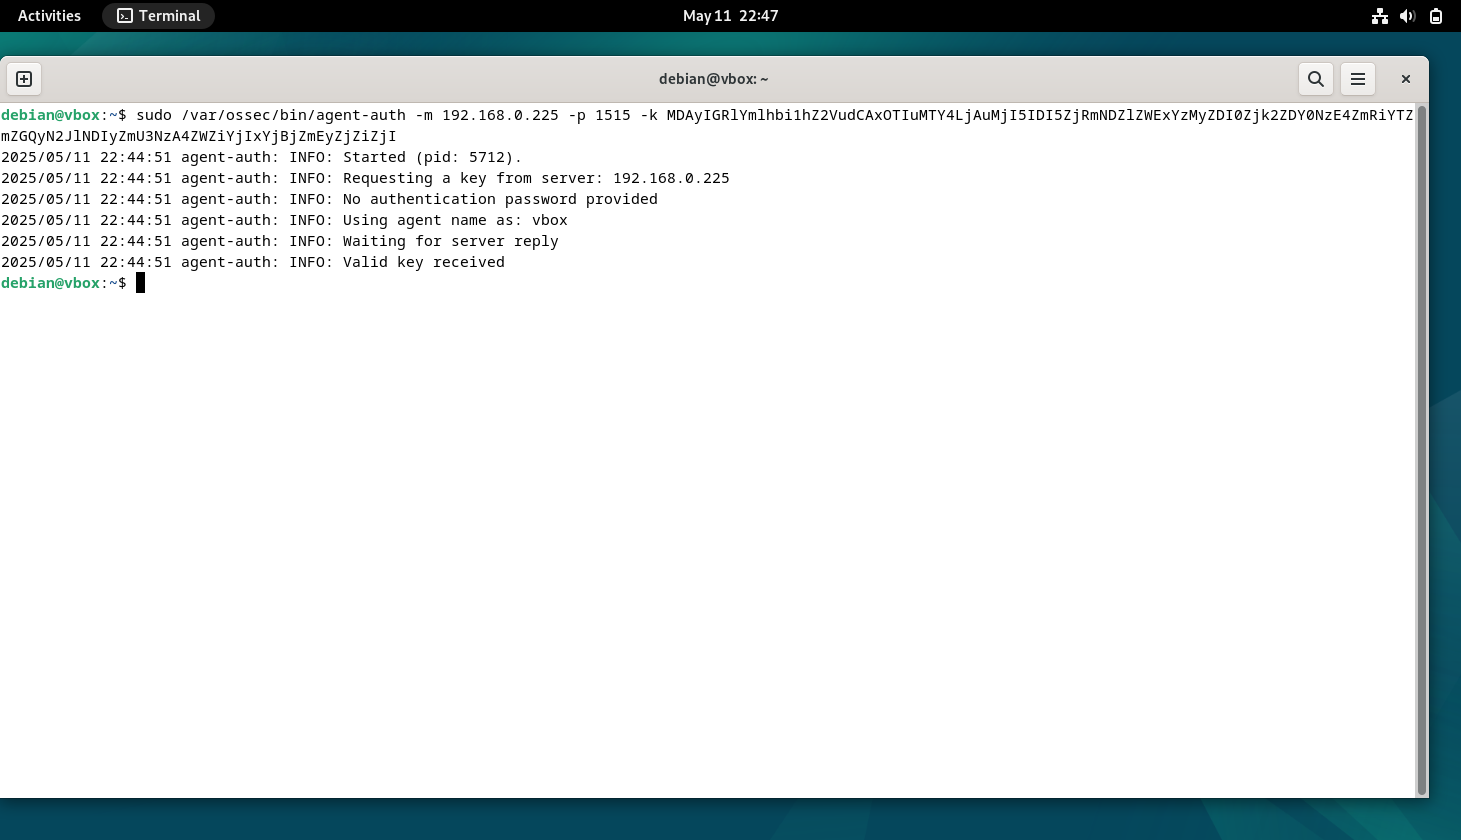
In this step, the Wazuh agent on the Debian virtual machine is being enrolled with the Wazuh Manager using the agent-auth command. The terminal shows the agent initiating a secure connection to the manager at IP address 192.168.0.225 on port 1515, using a provided pre-shared registration key. This method avoids the need for password-based authentication and relies on key-based trust to ensure secure communication. The agent identifies itself with the hostname "vbox" and waits for a response from the manager. Upon successful verification of the key, the manager confirms the registration by returning a "Valid key received" message. This enrollment is essential because it establishes a trusted link between the agent and the manager, allowing the agent to begin sending security events and system logs for monitoring. Without this step, the manager would reject data from the agent, as only registered agents are authorized to communicate with it.
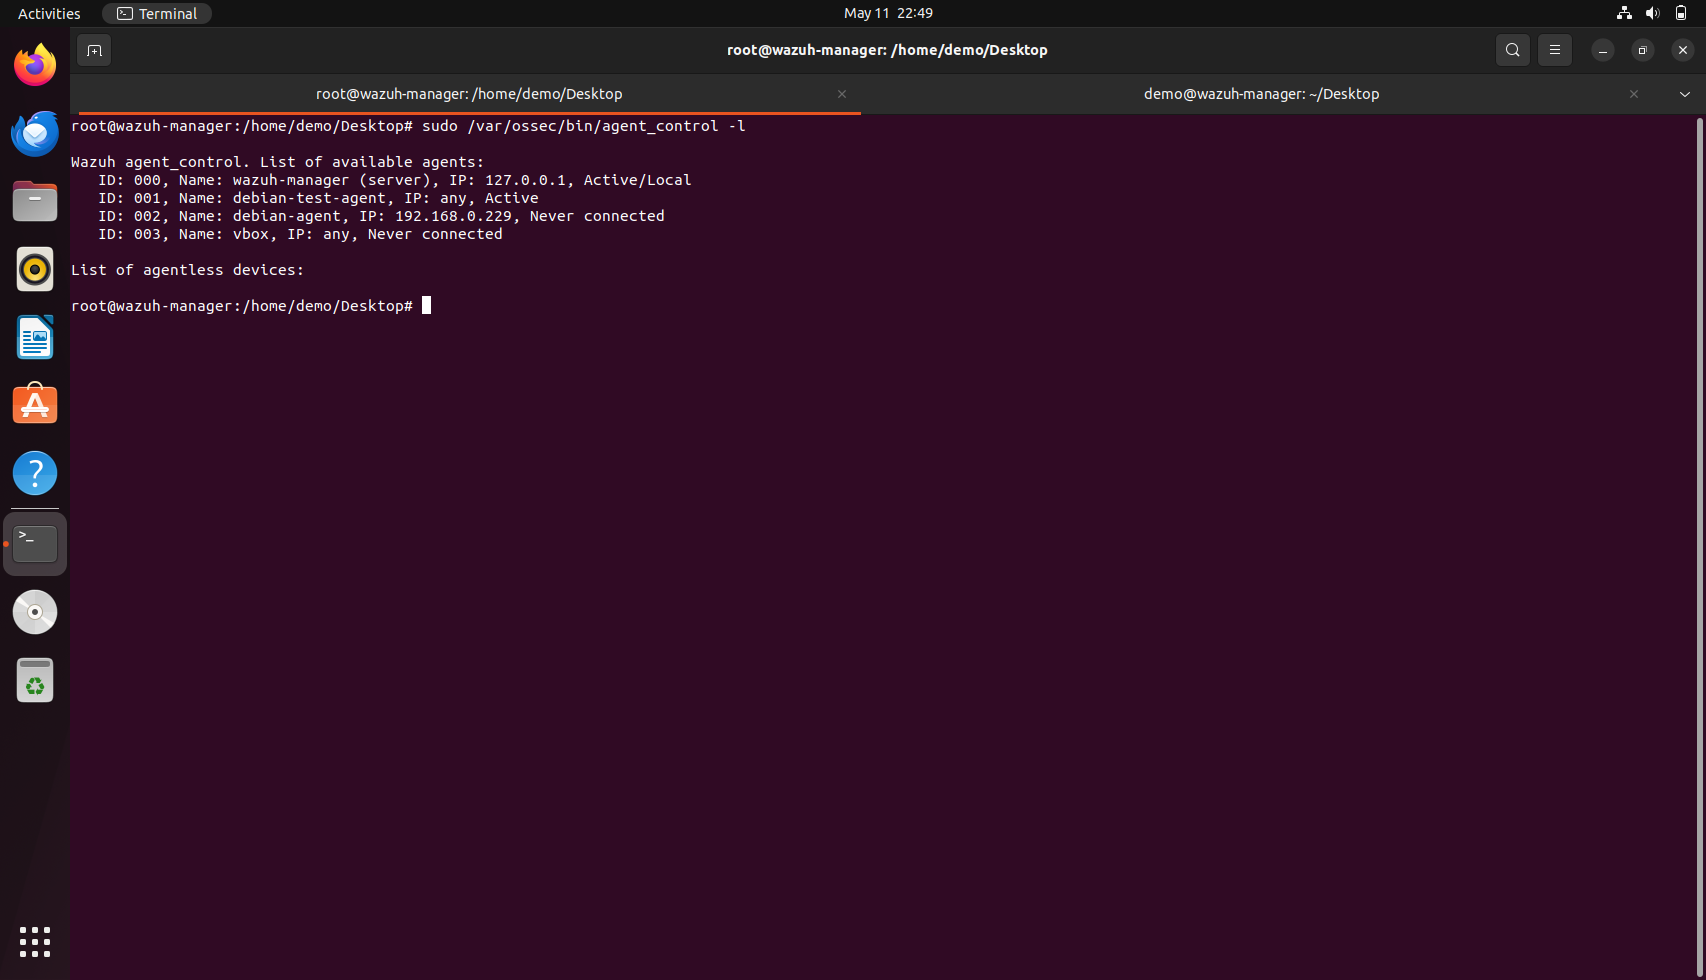
Step 5: Verifying connection between the manager and the agent
To verify that the Wazuh agent has been successfully installed and registered with the Wazuh manager, we can use the agent_control utility provided by Wazuh. By running the command sudo /var/ossec/bin/agent_control -l on the manager machine, we can list all agents currently registered with the server. This command displays important information such as the agent ID, agent name, IP address, connection status, and last keepalive time, confirming that the agent is active and communicating properly with the manager.
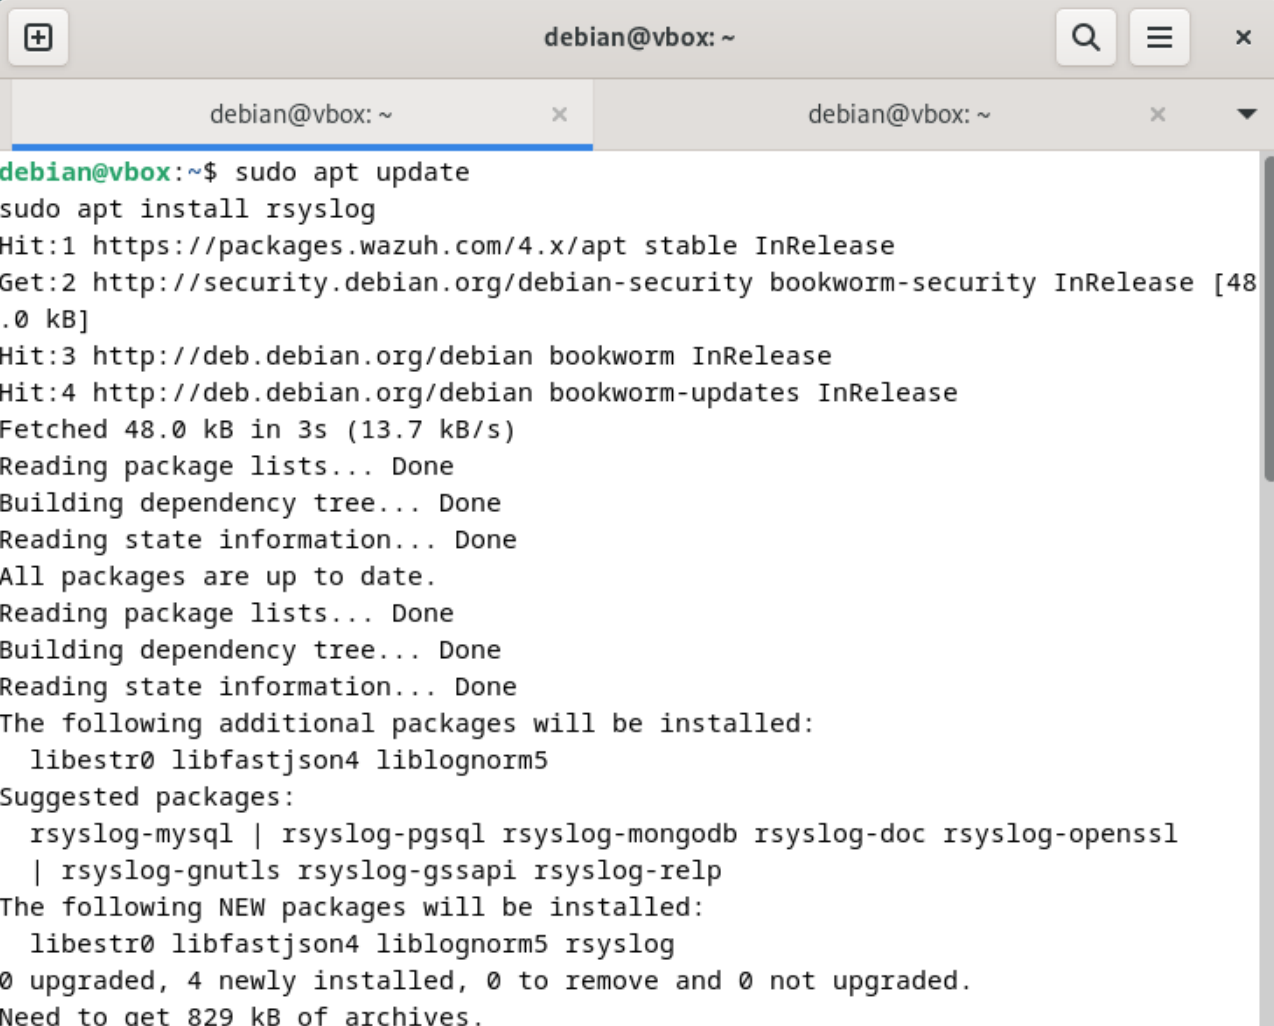
On minimal or custom Debian installations, particularly on virtual machines like VirtualBox, the traditional system log service rsyslog is often missing, resulting in the absence of critical log files such as /var/log/auth.log. Without this file, authentication events—including SSH login failures—are not captured in a format that security monitoring tools like Wazuh can process. Although modern systems may log authentication attempts within journald accessible via journalctl, Wazuh agents by default monitor traditional log files rather than querying journald directly.
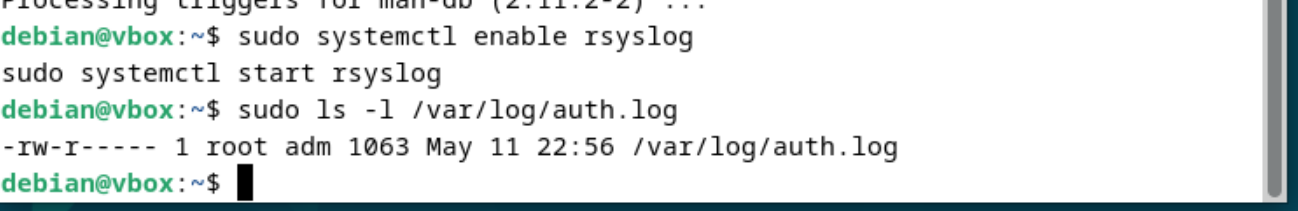
To resolve this, rsyslog must be installed and configured. Installing rsyslog (sudo apt update && sudo apt install rsyslog) and enabling its service (sudo systemctl enable --now rsyslog) ensures that authentication events are correctly written to /var/log/auth.log. Once rsyslog is active, SSH login attempts, both successful and failed, are properly logged.
Wazuh agents configured to monitor /var/log/auth.log can then detect and alert on events such as invalid user logins (Rule 5710) and multiple failed authentication attempts (Rule 2502), restoring full visibility into SSH activity for security operations.
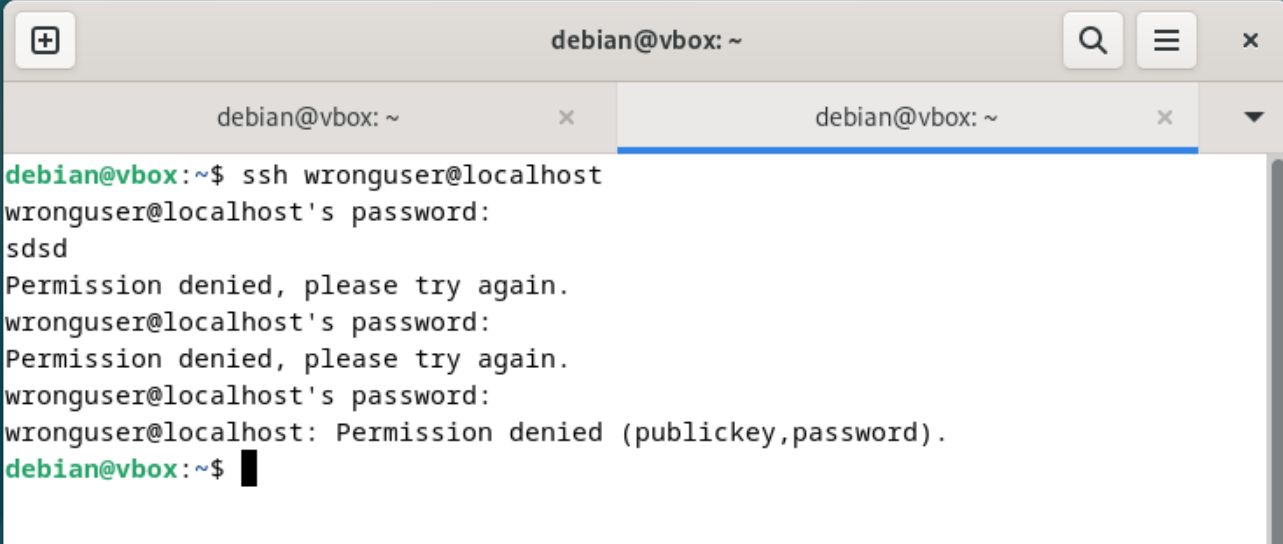
We can perform a deliberate SSH login failure by attempting to SSH to localhost with an invalid username: ssh wronguser@localhost. Enter any random password to trigger authentication logs.
The logs can be monitored using the command sudo tail -f /var/ossec/logs/alerts/alerts.json. on the Wazuh Manager machine.
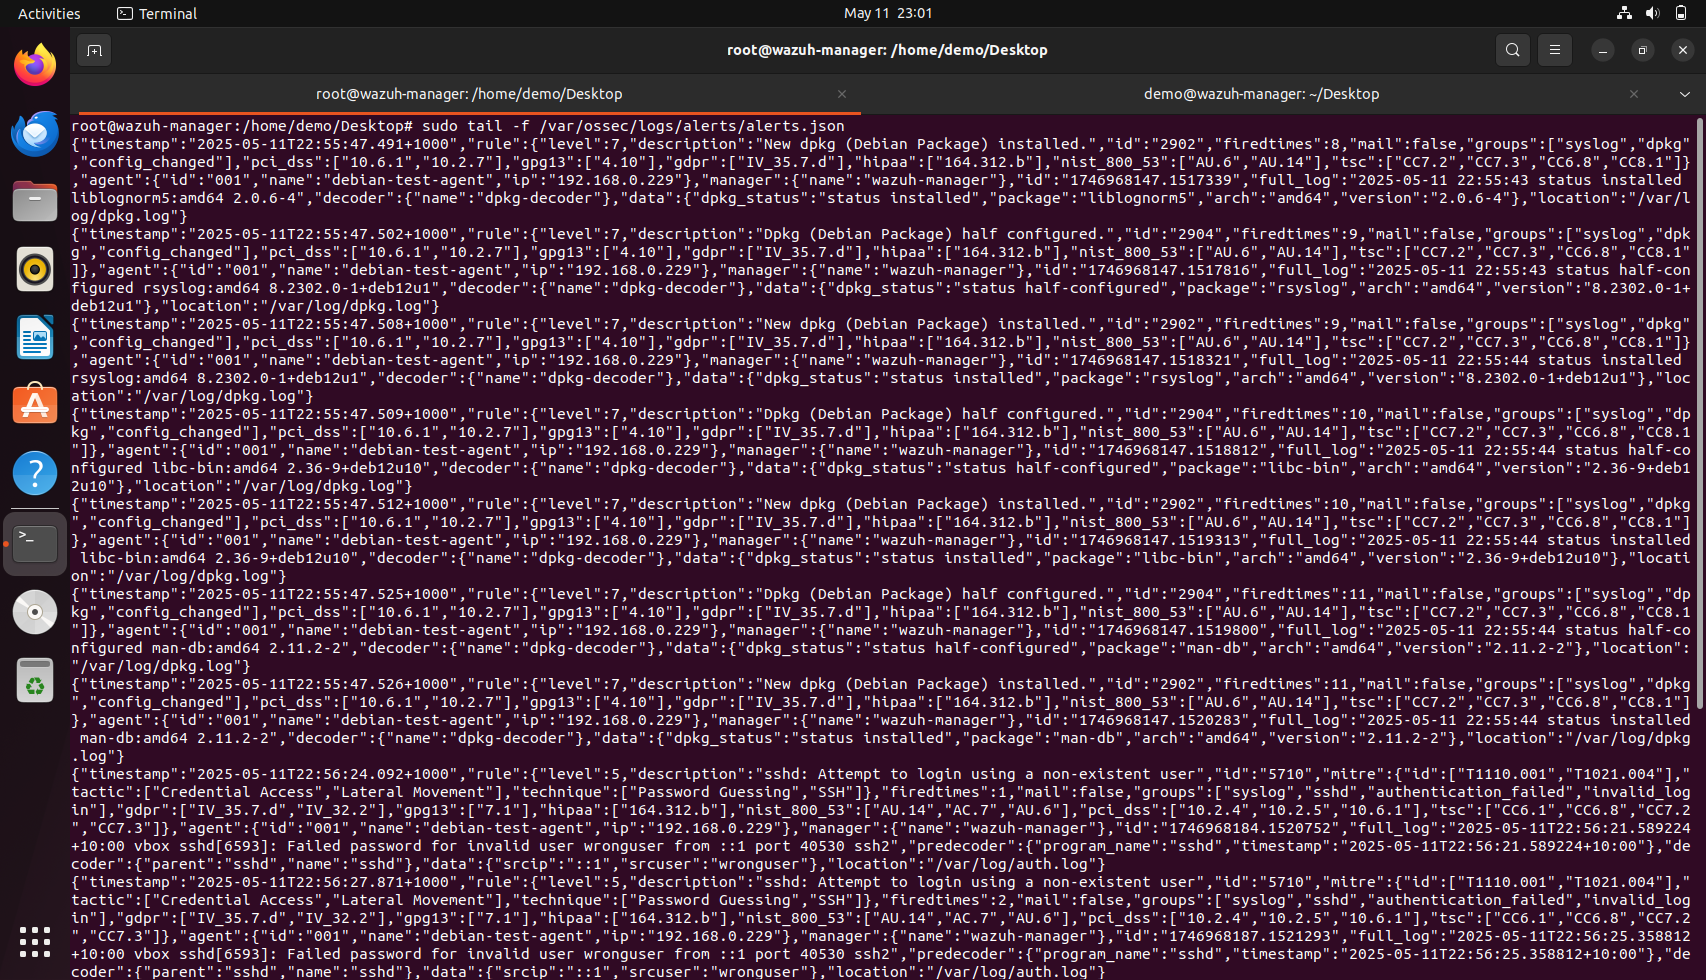
Restarting the Wazuh agent (sudo systemctl restart wazuh-agent) ensures the agent picks up the new log sources, and alerts can be validated by tailing /var/ossec/logs/alerts/alerts.json on the Wazuh Manager. Similarly, we can configure multiple agents as needed with the Wazuh manager by following the steps outlined above.
Step 6: Wazuh Platform Setup: Manager, Indexer, and Dashboard
To build a complete security monitoring and threat detection platform, we will extend the existing Wazuh Manager setup by installing the Wazuh Indexer and the Wazuh Dashboard, thereby completing the Wazuh All-in-One architecture. The Wazuh Manager acts as the core backend component responsible for receiving and processing security events from the agents. The Wazuh Indexer, a customised and optimised fork of OpenSearch, is responsible for storing and indexing event data efficiently. The Wazuh Dashboard provides an intuitive web-based graphical user interface (GUI) to visualise alerts, manage security rules, monitor agent statuses, and perform investigations in real-time. By setting up the full Wazuh Platform, users can achieve seamless log management, advanced threat detection, and centralised security event analysis without relying on external components such as Elasticsearch, Logstash, or Kibana. This self-contained setup enhances system simplicity, reduces operational overhead, and improves integration between core platform services.
Before proceeding with the installation, ensuring that the underlying system can support all components of the Wazuh Platform efficiently is critical. The Ubuntu VM intended for deployment should meet the minimum requirements: at least 2 virtual CPUs, 4 GB of RAM (although 6–8 GB is recommended for better performance), and 20 GB or more of available disk space. These resources are necessary to handle the simultaneous operation of the Wazuh Manager, Wazuh Indexer, and Wazuh Dashboard services, particularly as the volume of log ingestion and alert generation increases. Additionally, the server must have a stable internet connection to fetch packages from official Wazuh repositories, and administrative privileges (sudo access) are required for software installation and configuration.
Pre-requisite: Since we have already set up the Wazuh manager, we will not be adding the Wazuh repository again, but if you are not sure, you can always add the official repository and import its GPG signing key using the command:
curl -s https://packages.wazuh.com/key/GPG-KEY-WAZUH | sudo gpg --dearmor -o /usr/share/keyrings/wazuh-archive-keyring.gpg
echo "deb [signed-by=/usr/share/keyrings/wazuh-archive-keyring.gpg] https://packages.wazuh.com/4.x/apt/ stable main" | sudo tee /etc/apt/sources.list.d/wazuh.list

sudo apt update
-
First, install the required Java 17 runtime environment: sudo apt install openjdk-17-jdk -y If you already have Java installed or want to check if it’s installed, then you can use the command
java -version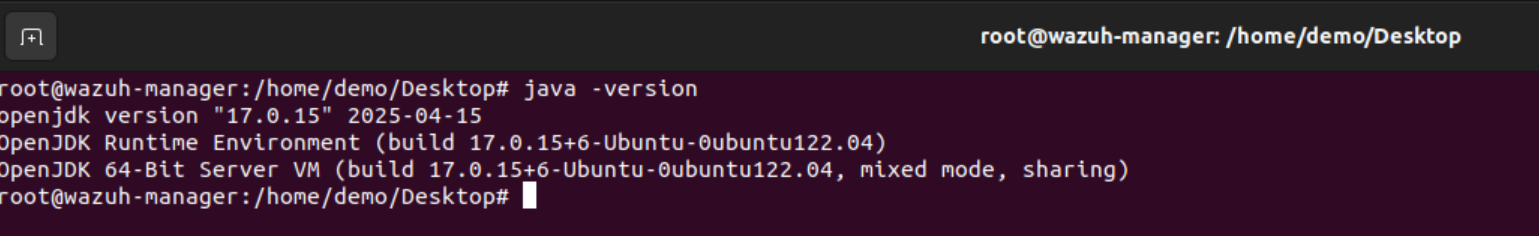
-
Download the official installation assistant:
curl -sO https://packages.wazuh.com/4.12/wazuh-install.sh

curl -sO https://packages.wazuh.com/4.12/config.yml

- Edit config.yml using the command nano config.yml and find the nodes section and enter the IP address of your Ubuntu VM in all the fields where your Ubuntu IP address is mentioned.
- Generate SSL certs and passwords using the command
bash wazuh-install.sh --generate-config-files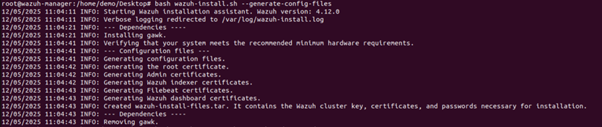
- Install Wazuh Indexer using Assisted Method:
bash wazuh-install.sh --wazuh-indexer node-1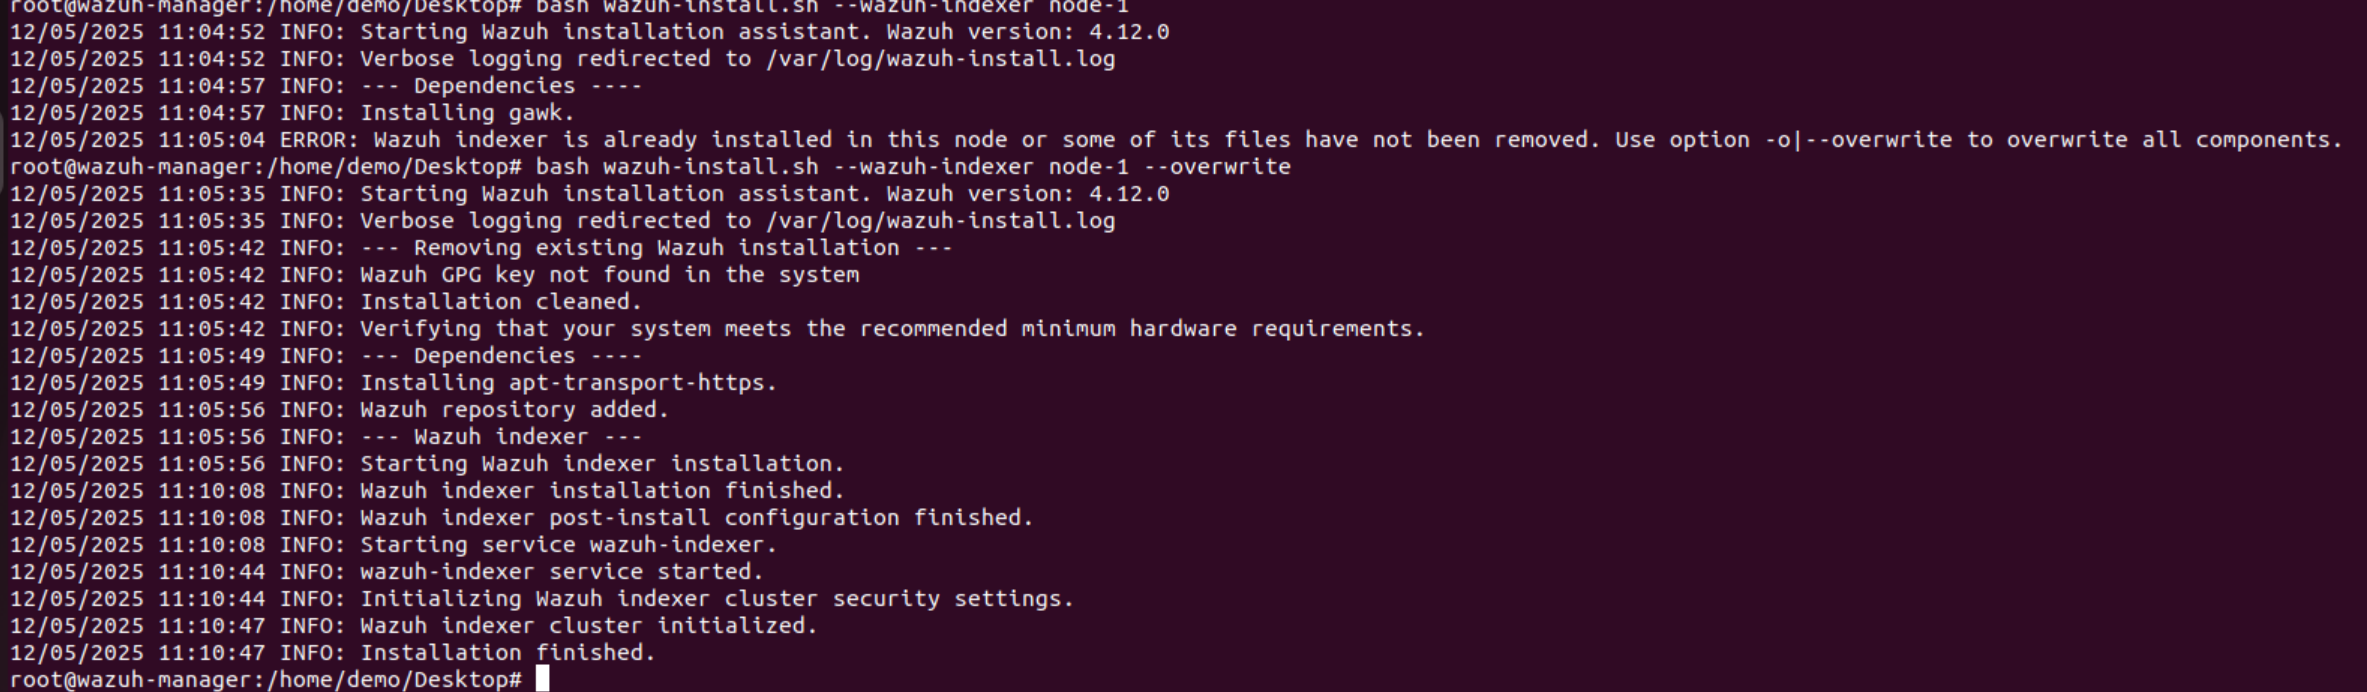
- Initialise Wazuh Cluster (Start Security) with the command
bash wazuh-install.sh --start-cluster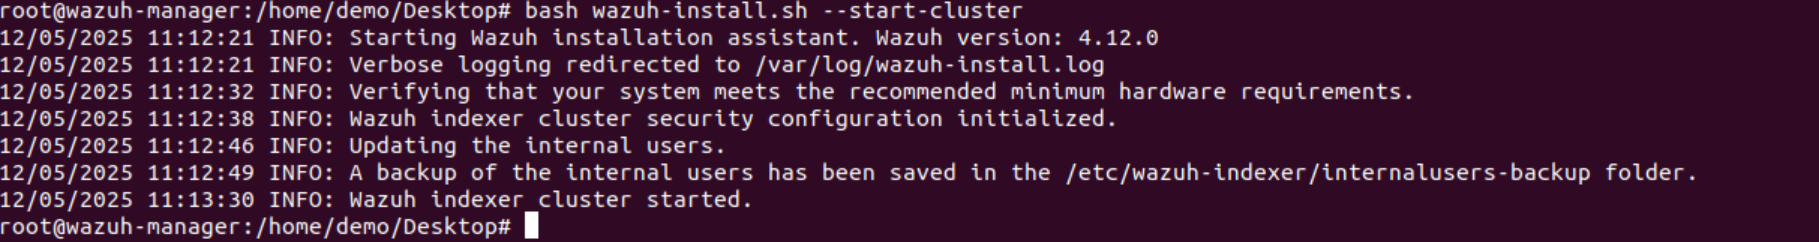 This automatically runs securityadmin, sets up passwords, and cluster keys
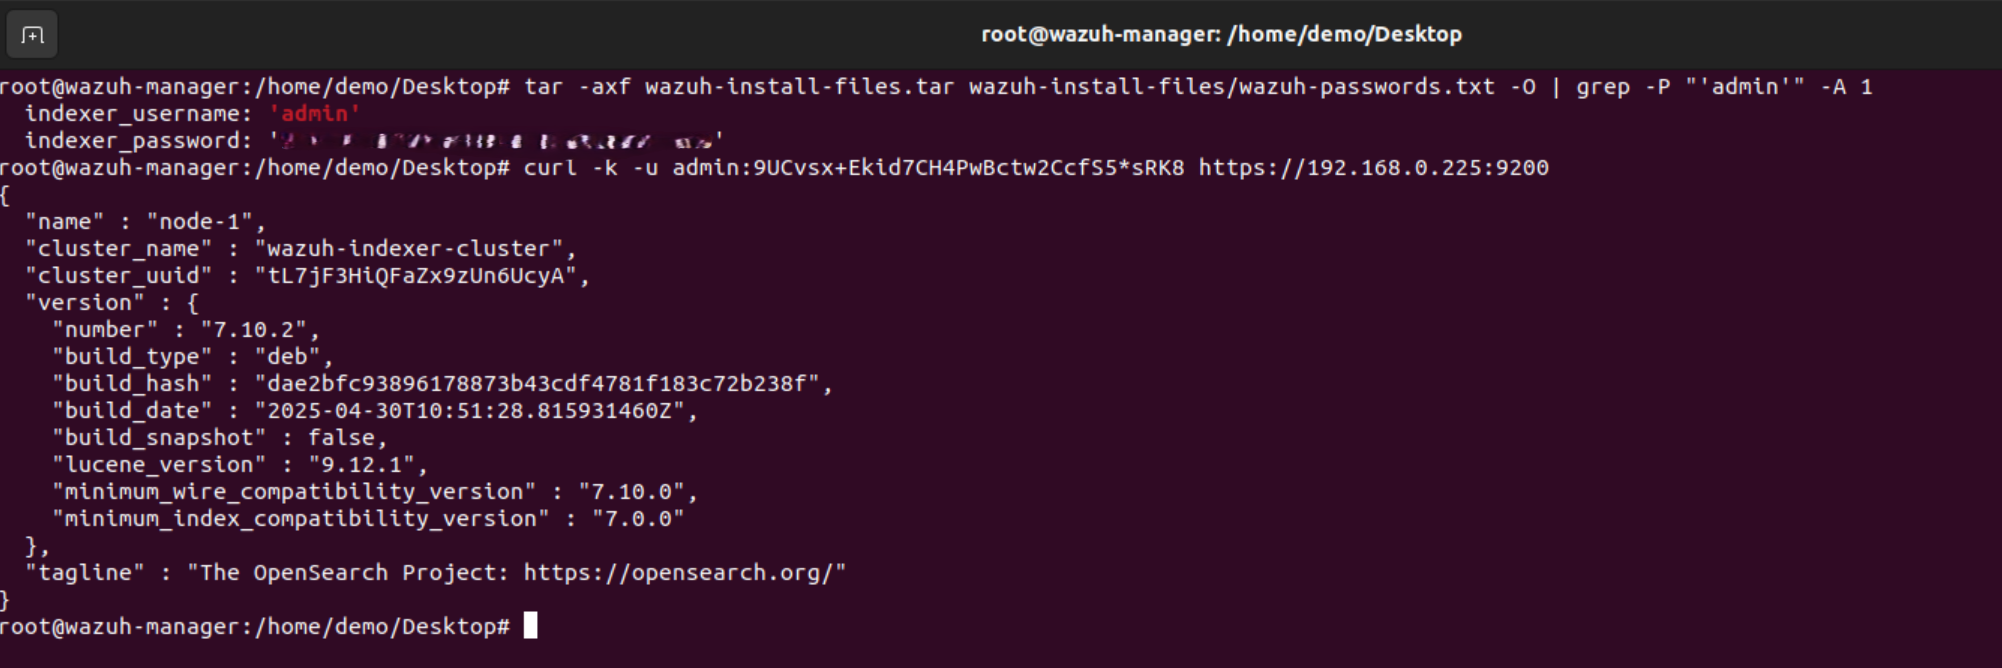
 - Get the admin password:
tar -axf wazuh-install-files.tar wazuh-install-files/wazuh-passwords.txt -O | grep -P "'admin'" -A 1
- Then test:
curl -k -u admin:<your-found-password> https://<your-ubuntu-ip-address>:9200
- We will now install the Wazuh dashboard, which can be done using the command
bash wazuh-install.sh --wazuh-dashboard dashboard
dashboard matches the dashboard name you wrote in config.yml (dashboard: section). This will install the full Wazuh Dashboard, SSL certs, Nginx proxy, everything.
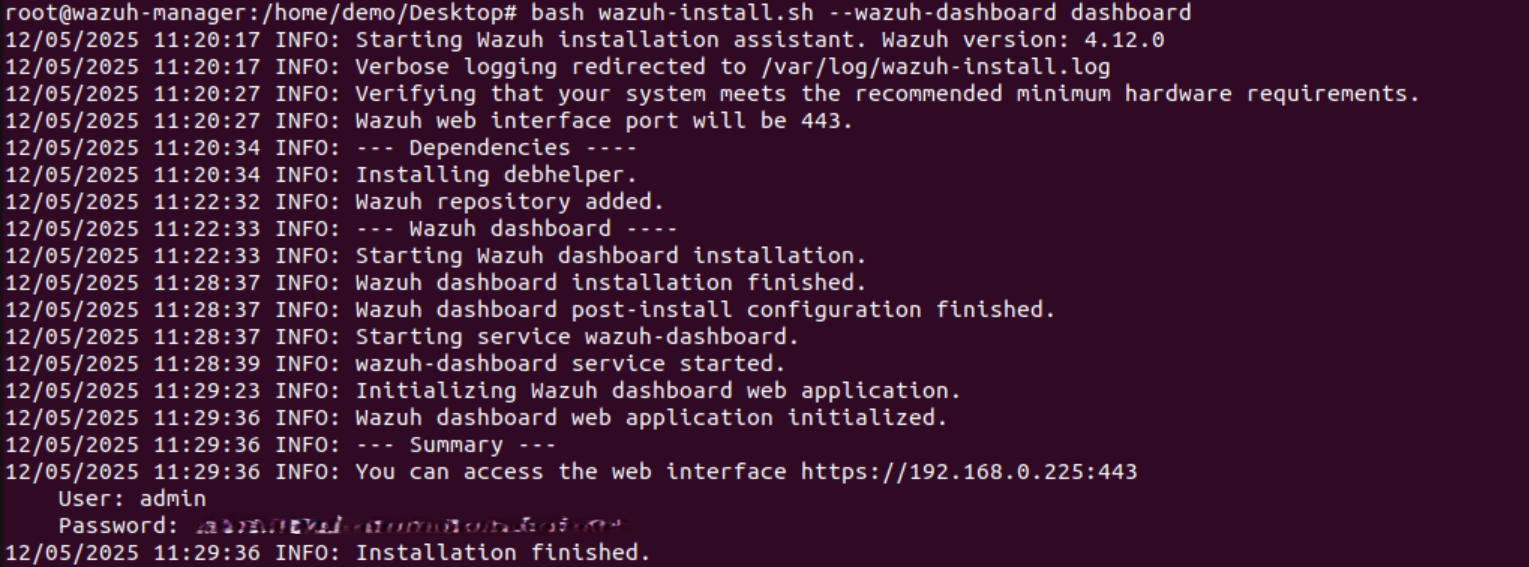 Make a note of the username and password. These are the credentials that we will be using to log in to the dashboard.
- After Installation, start the Cluster:
bash wazuh-install.sh --start-clusterThis connects the Wazuh Indexer, Wazuh Server, and Dashboard securely.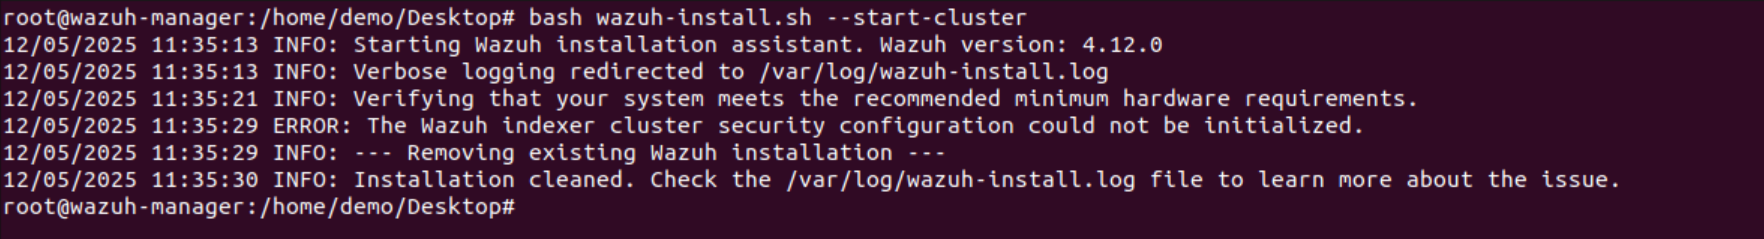 The Wazuh Dashboard can now be accessed using
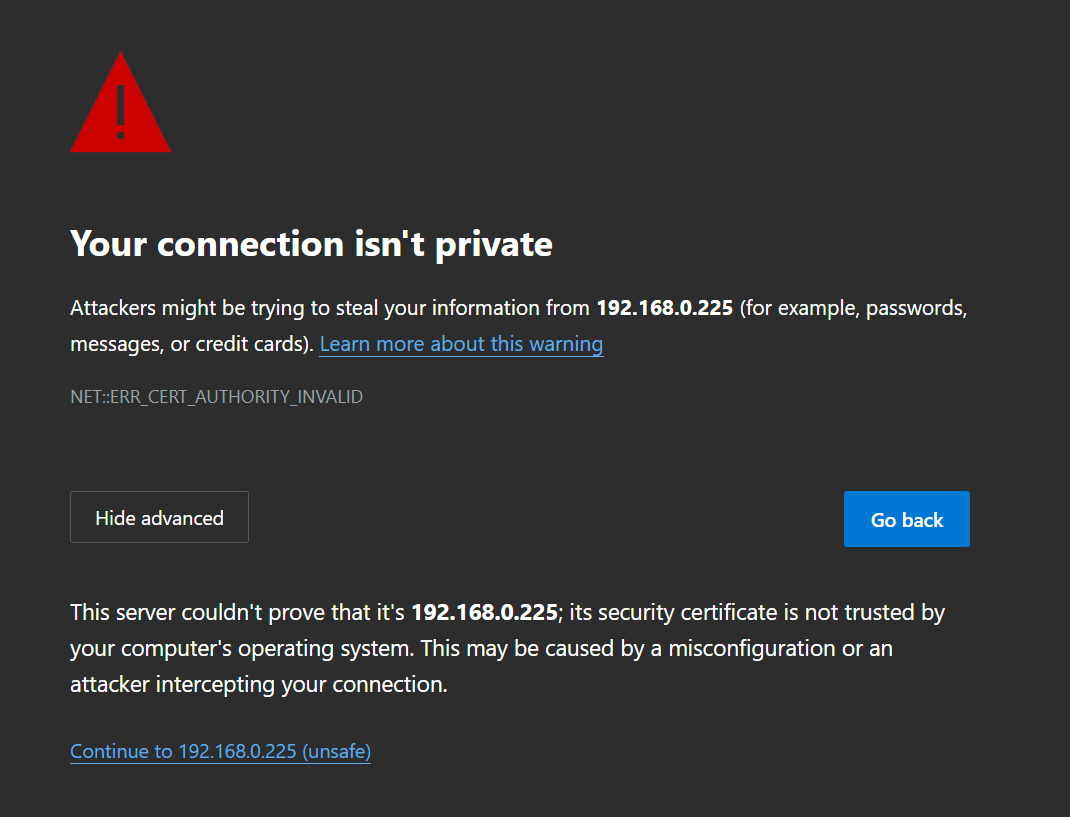
 https://<your-server-ip>/For the first time, we will see that a connection isn’t a private message being displayed in the browser, which is expected. Click on Advanced, and then continue to Ubuntu Manager IP Address
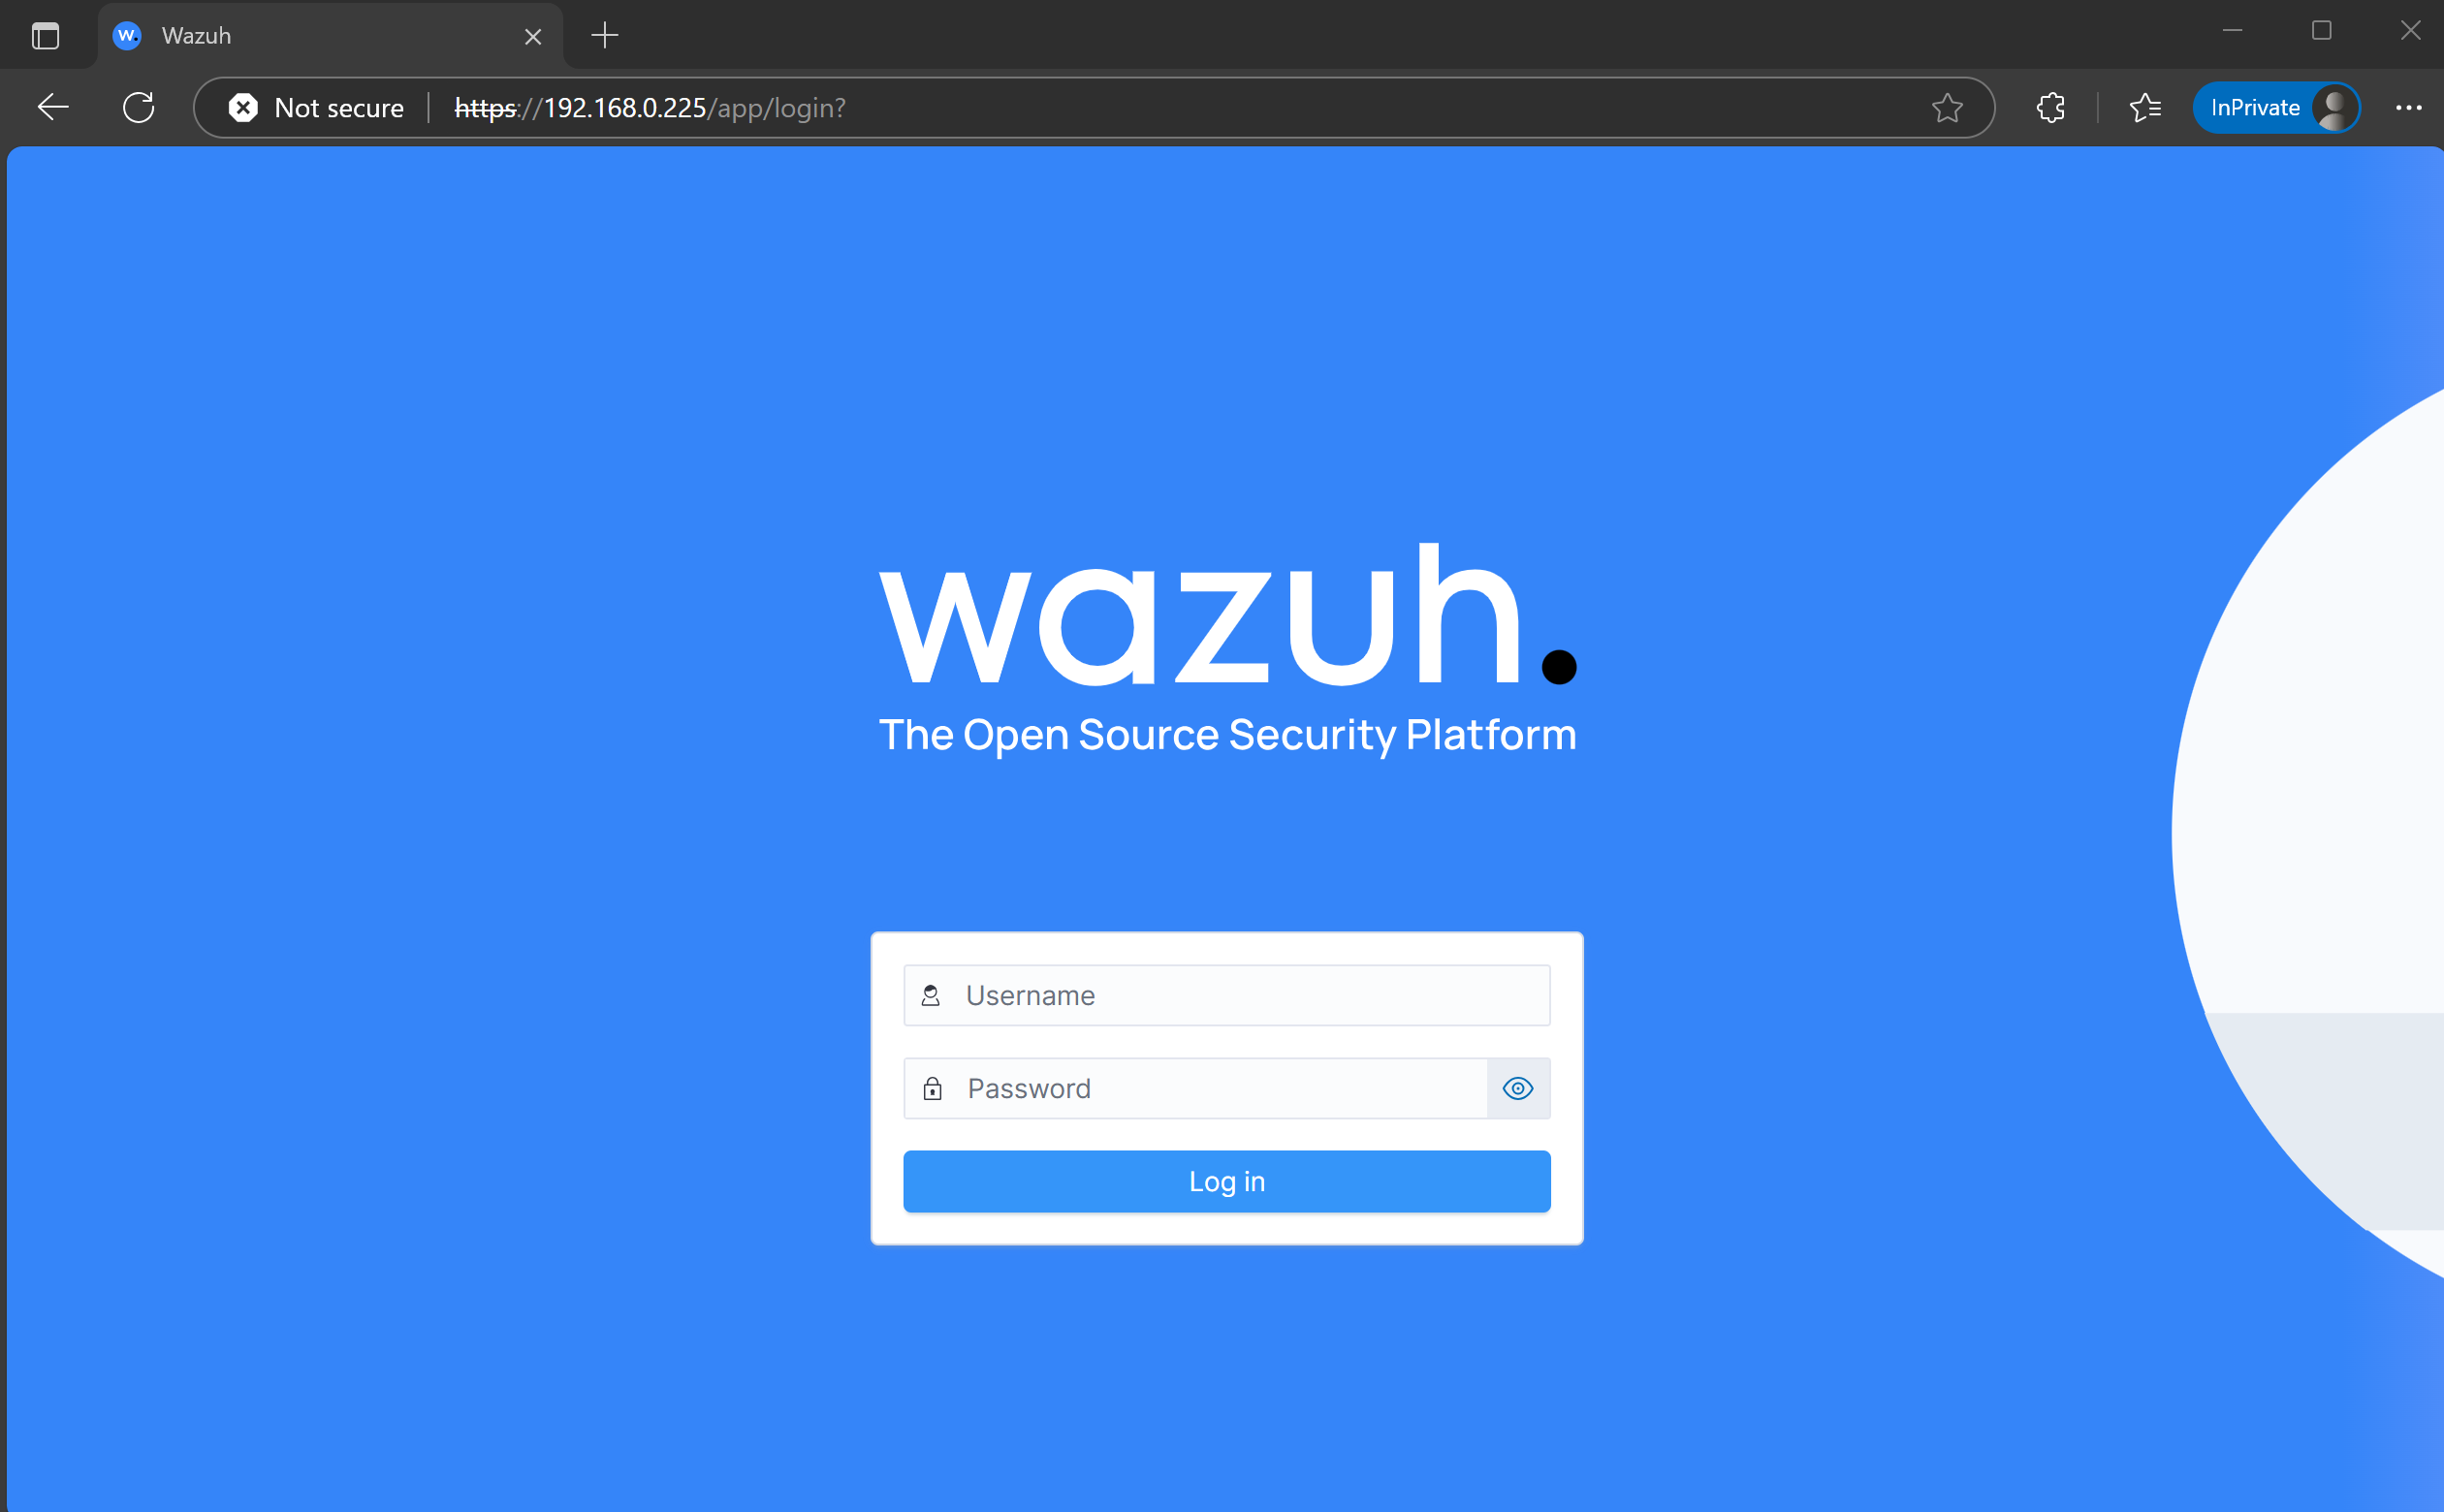
 The wazuh dashboard will now load, where we can log in with the set of credentials that we had noted down earlier during the installation.
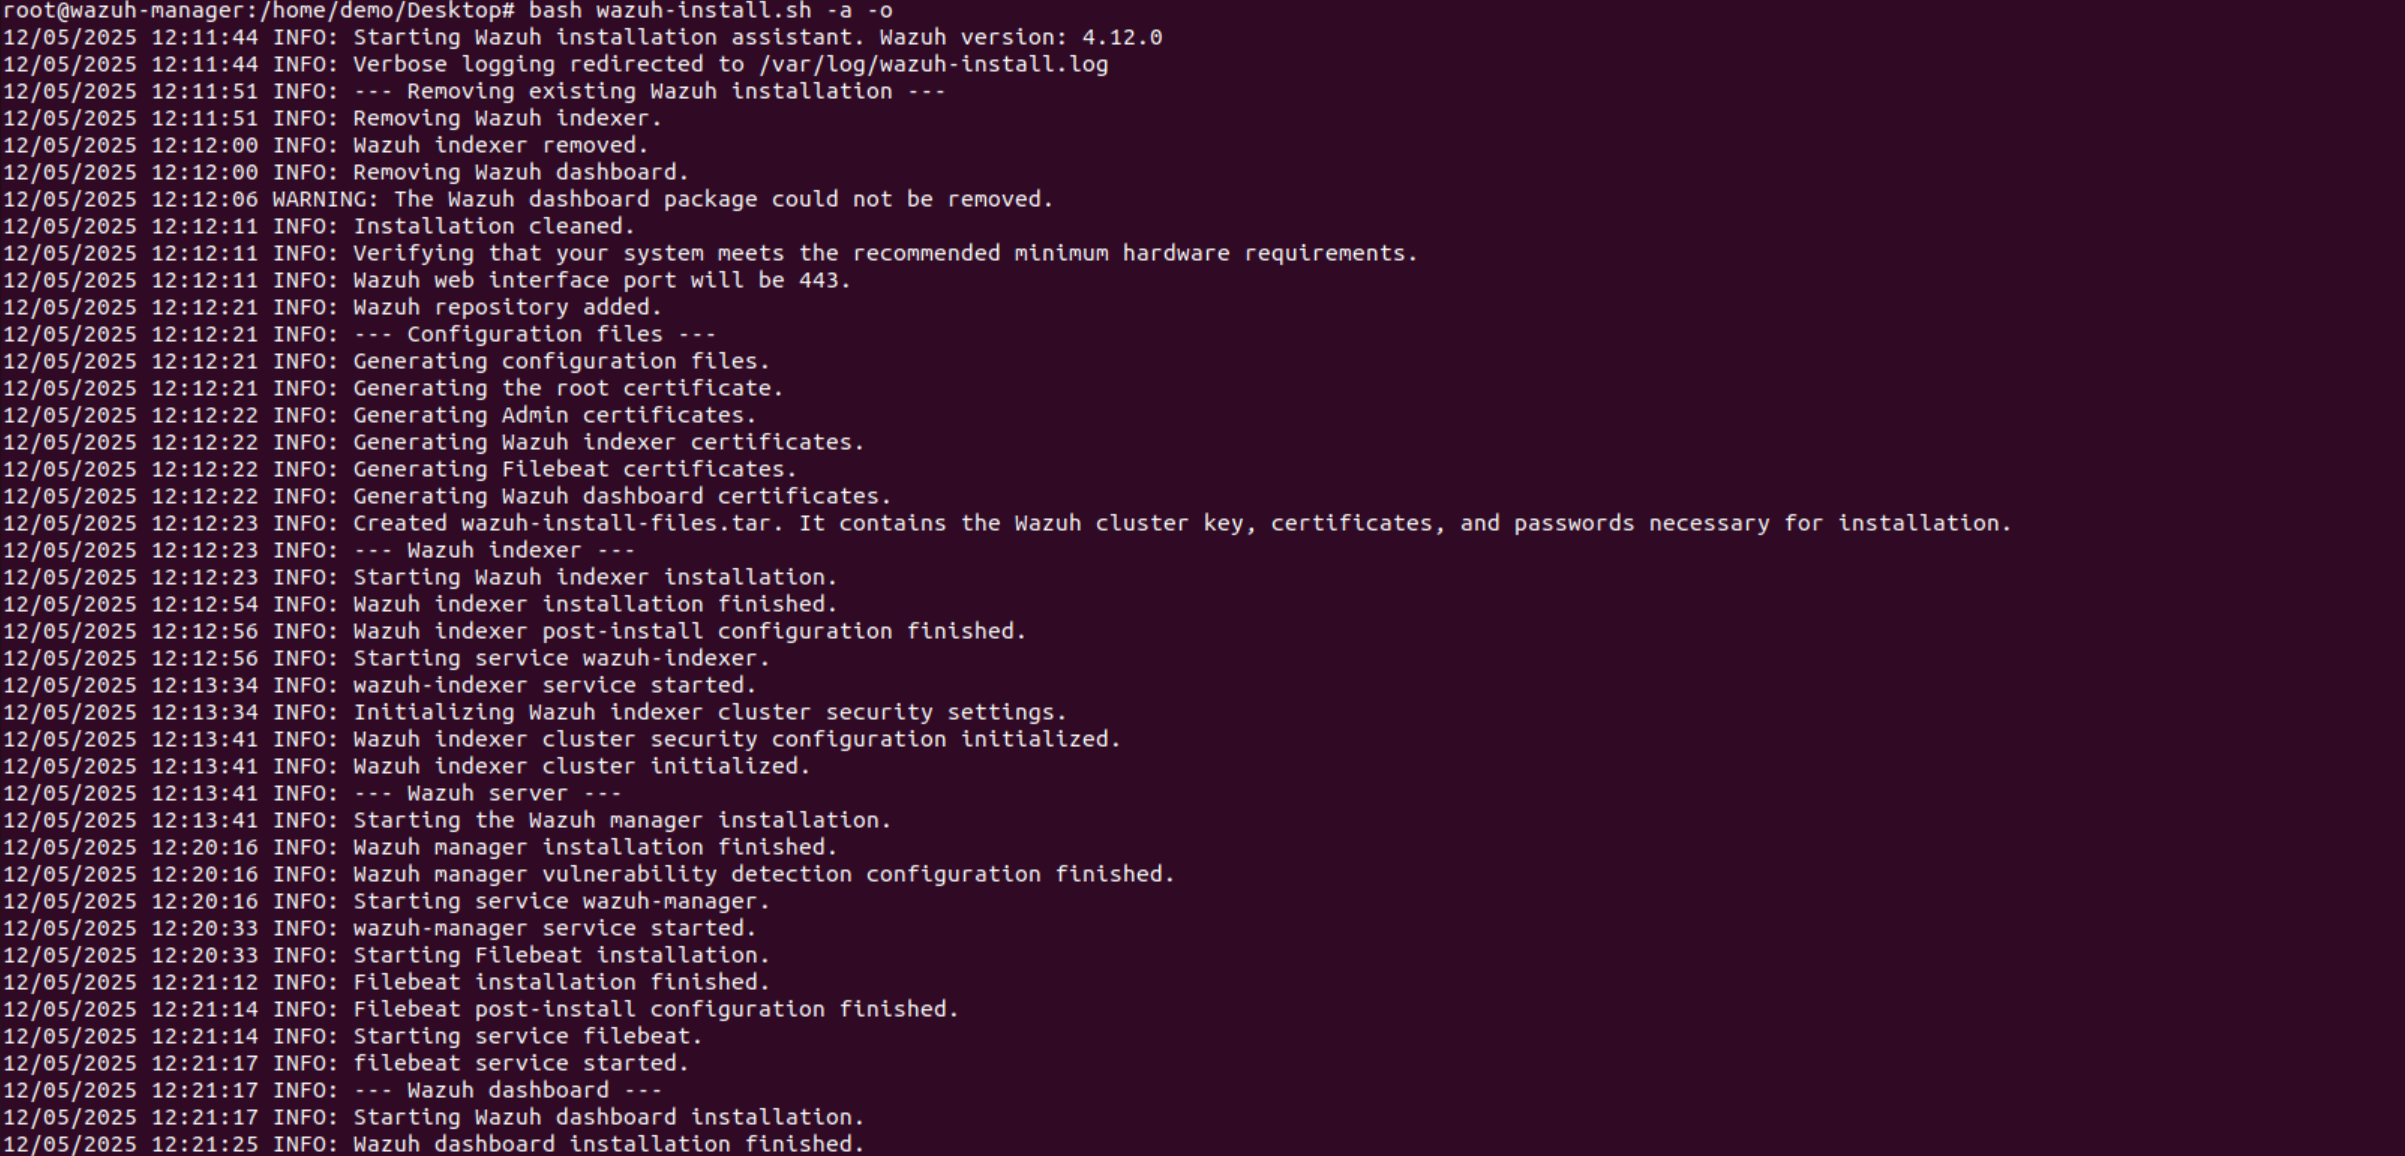
Another way to install all 3 (Wazuh – manager, indexer, and dashboard) together would be using the command:
bash wazuh-install.sh -a
The command bash wazuh-install.sh -a runs the Wazuh installation script with the -a flag, which typically initiates an automated installation of the Wazuh components, including the manager, indexer, and dashboard, in a single deployment. While this approach simplifies setup, installing these components separately allows for better scalability, performance optimisation, and fault isolation. By configuring the manager, indexer, and dashboard independently, administrators gain greater flexibility to fine-tune each service according to workload demands, improving resource allocation and system stability. Additionally, separating these components facilitates troubleshooting and maintenance, reducing the risk of a single point of failure affecting the entire system. This modular installation also enhances security by enabling stricter access controls for each service.
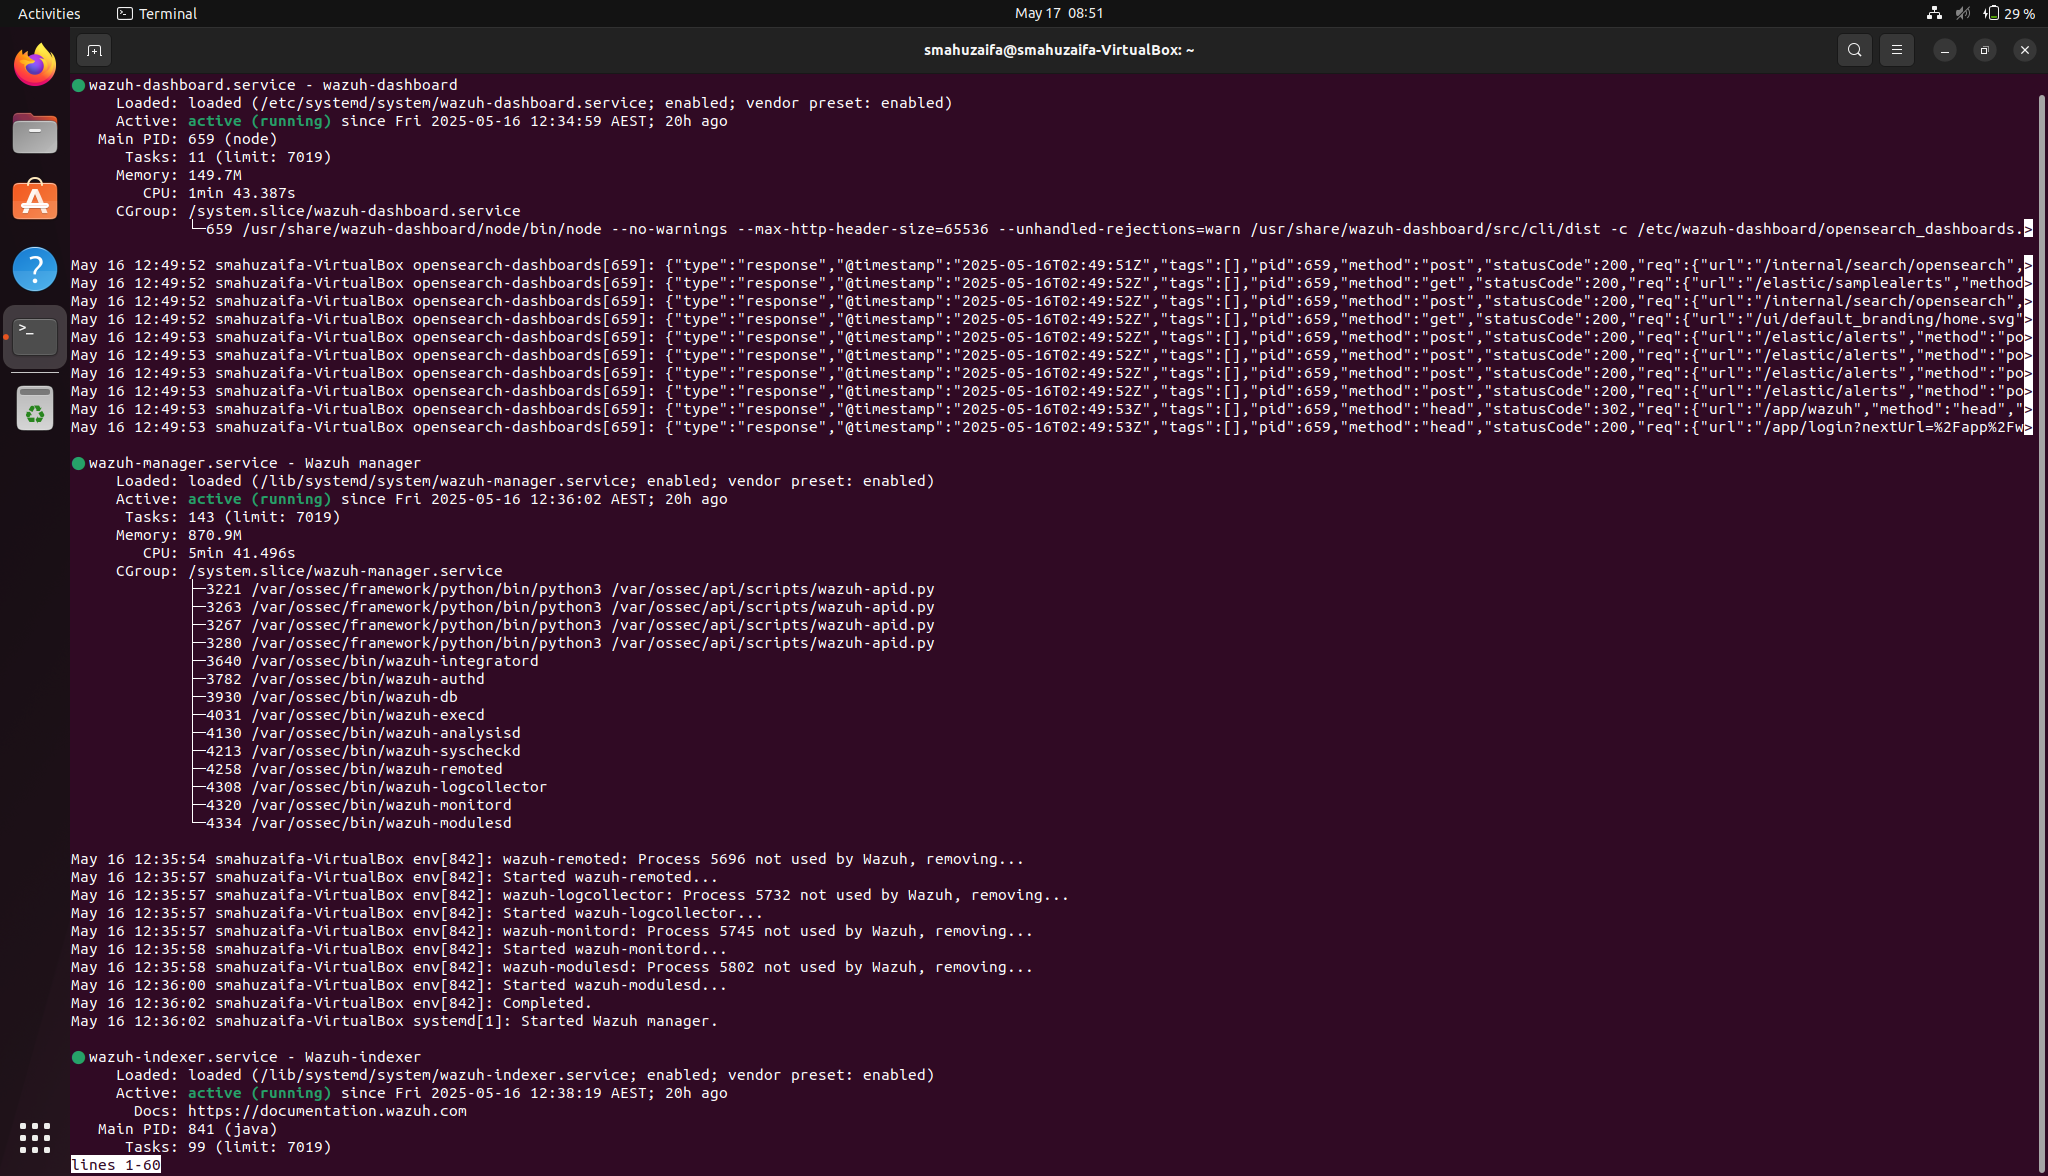
Once everything is installed, you should see the status like this. The command to check the status of all 3 together would be
sudo systemctl status wazuh-manager wazuh-dashboard wazuh-indexer
(They can be in any order in the above command)
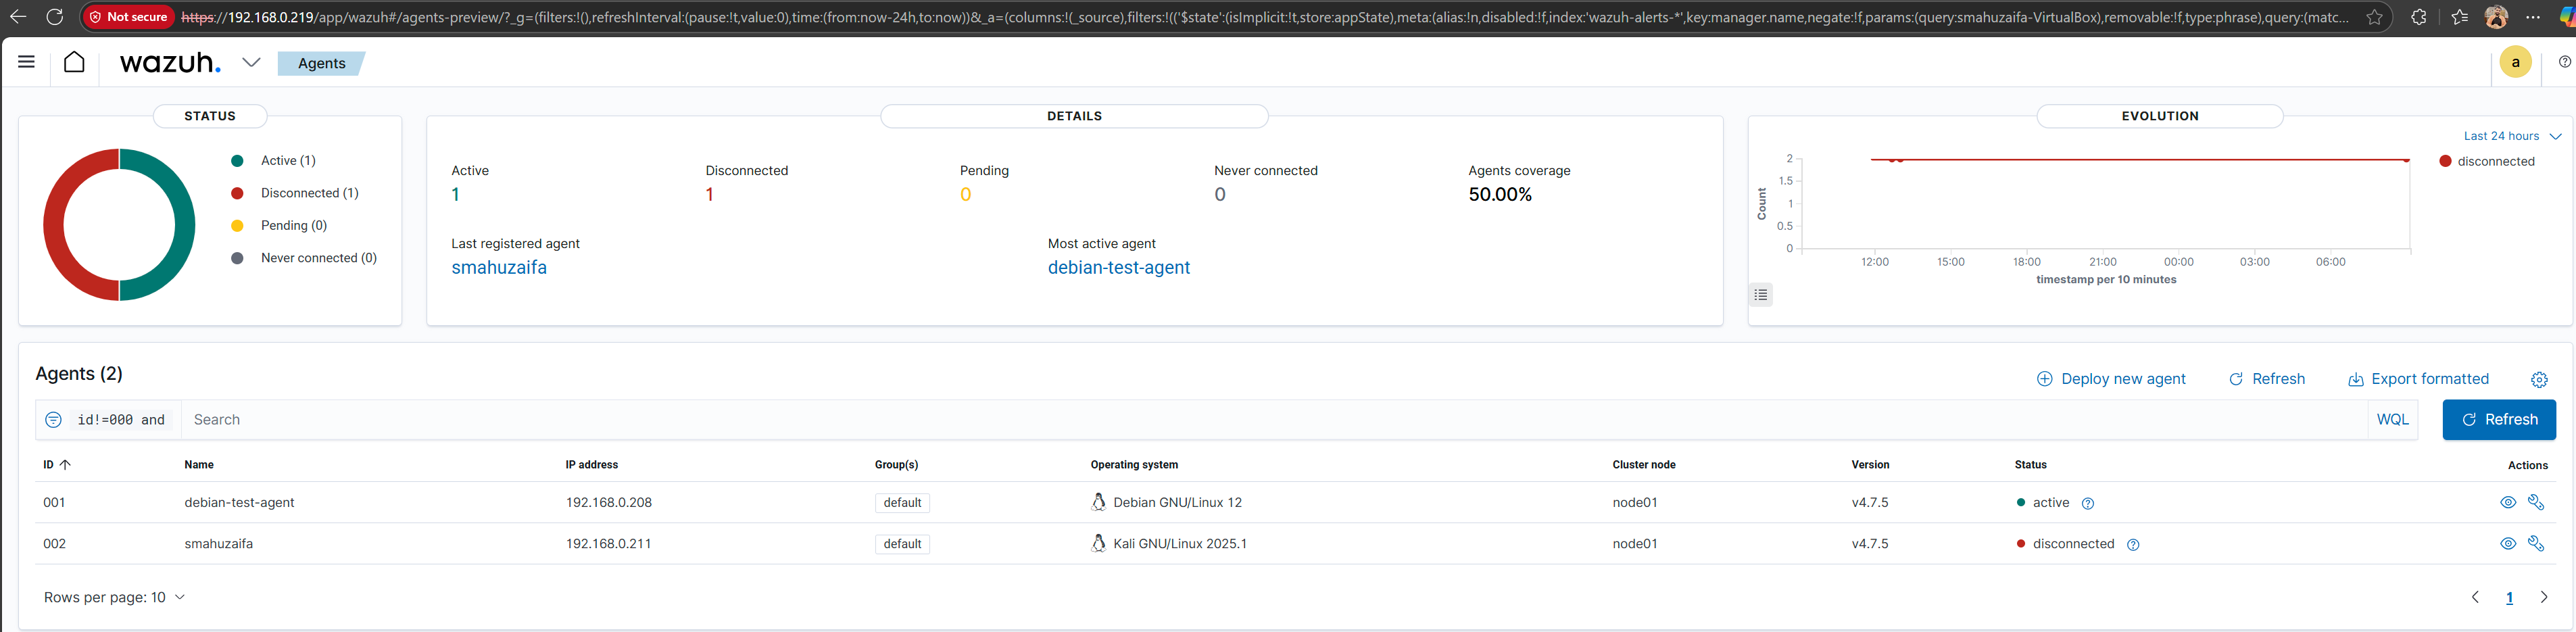
Once everything is set up and connected, we can check the connection status between the Wazuh Manager and its agent on the agents page in Wazuh.